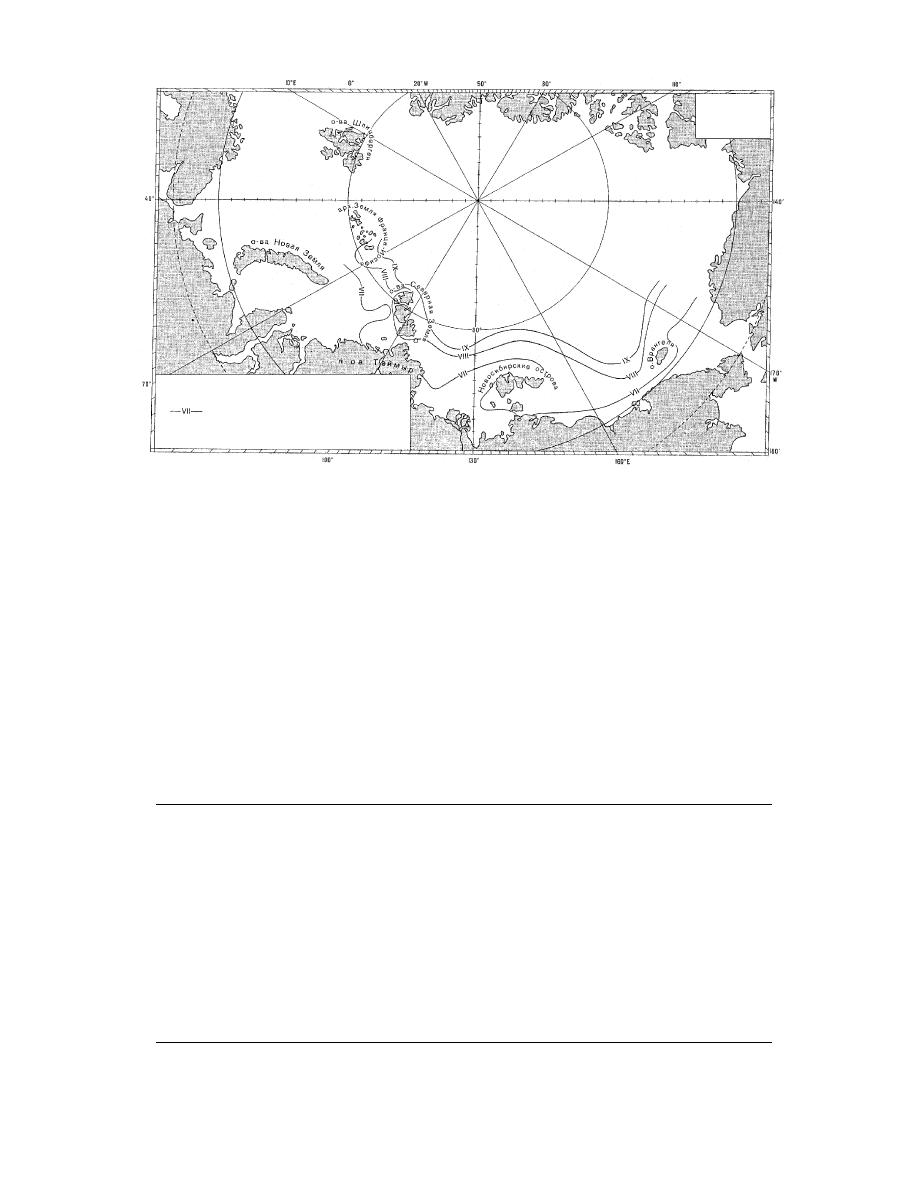
July
September
Average Ice Edge (month)
Figure 18. Mean sea-ice extent for concentrations of 7/10ths and greater for July through September.
(Translated from RSMOT, in prep.)
ized by near-freezing air temperatures that pro-
shelf lying at relatively shallow depth over vast
duce little ice growth or decay. Shipping activity
areas. For example, the average depth of the entire
routinely occurs throughout the melt and the au-
East Siberian and Chukchi Seas is only 58 m and
tumn interphase. The Russians would like to ex-
88 m, respectively (streng 1991). Tidal changes
tend the shipping season into the freeze period
range from 5 to 7 m in the Laptev Sea, from 3 to 4
and the spring interphase. Table 7 provides a sum-
m in the East Siberian Sea, and are no more than 2
mary of the environmental conditions encountered
to 2.5 m in the Kara Sea (Buzuev 1991). The limit-
in the Eurasian seas of the Northern Sea Route.
ing depths for navigation are those found in the
As previously mentioned, the bathymetry of the
various straits. Most exceed 20 m, except the
Russian Arctic is characterized by the continental
Sannikova and Dmitriya Lapteva straits located
Table 7. Summary of environmental conditions of the Eurasian seas along the Northern Sea Route
(from Barnett 1991).
Barents
West Kara
East Kara
Laptev
E. Siberian
Chukchi
Mean air temp. (C)
Winter
10 to 15
15 to 20
25 to 30
30
30
20 to 30
Summer
--
5
2
--
2 to 5
2 to 5
Mean fast ice
thickness (cm)
50 to 150
120 to 200
200
200 to 250
170 to 200
130 to 180
Average date of
minimum ice
cover
15 Sept
24 Sept
14 Sept
17 Sept
13 Sept
12 Sept
Summer ice cover
relative to winter max.
extent (% of area)
10
25
48
47
57
20
Average date of
complete freeze-up
Never
Mid late Nov
Mid Nov
--
Mid Oct
Mid late Nov
Average date of
min. ice extent
15 Sept
24 Sept
14 Sept
17 Sept
13 Sept
12 Sept
25


 Previous Page
