Est.
Proj.
Proj.
Proj.
Mode
1991
1992
1993
1994
1995
All Traffic
23,601
19,088
17,700
18,201
19,101
including General Purpose
5,855
4,374
4,560
4,725
4,900
Railway
7,745
6,678
6,170
6,300
6,550
including General Purpose
1,956
1,825
1,910
1,975
2,050
Road
14,688
11,504
10,703
11,073
11,724
including General Purpose*
2,731
2,550
2,650
2,750
2,850
including Rosavtotrans†
2,396
2,350
2,250
2,325
2,450
including Own Account
11,957
10,700
10,900
11,100
11,900
River
564
374
339
363
382
including General Purpose
50
47
46
51
55
Sea
103
101
87
90
94
Pipelines
499
430
400
373
348
Air
2
1
1
2
2
* Includes international, intracity, intercity.
† Excludes Mosavtotrans and St. Petersburgavtotrans. As of 1993, "Rosavtotrans" will be a
Russian joint stock trucking company.
25,000
20,000
15,000
10,000
All Traffic
Road
5,000
Railways
Pipelines
River
0
1991
Sea
1992
1993
Air
1994
1995
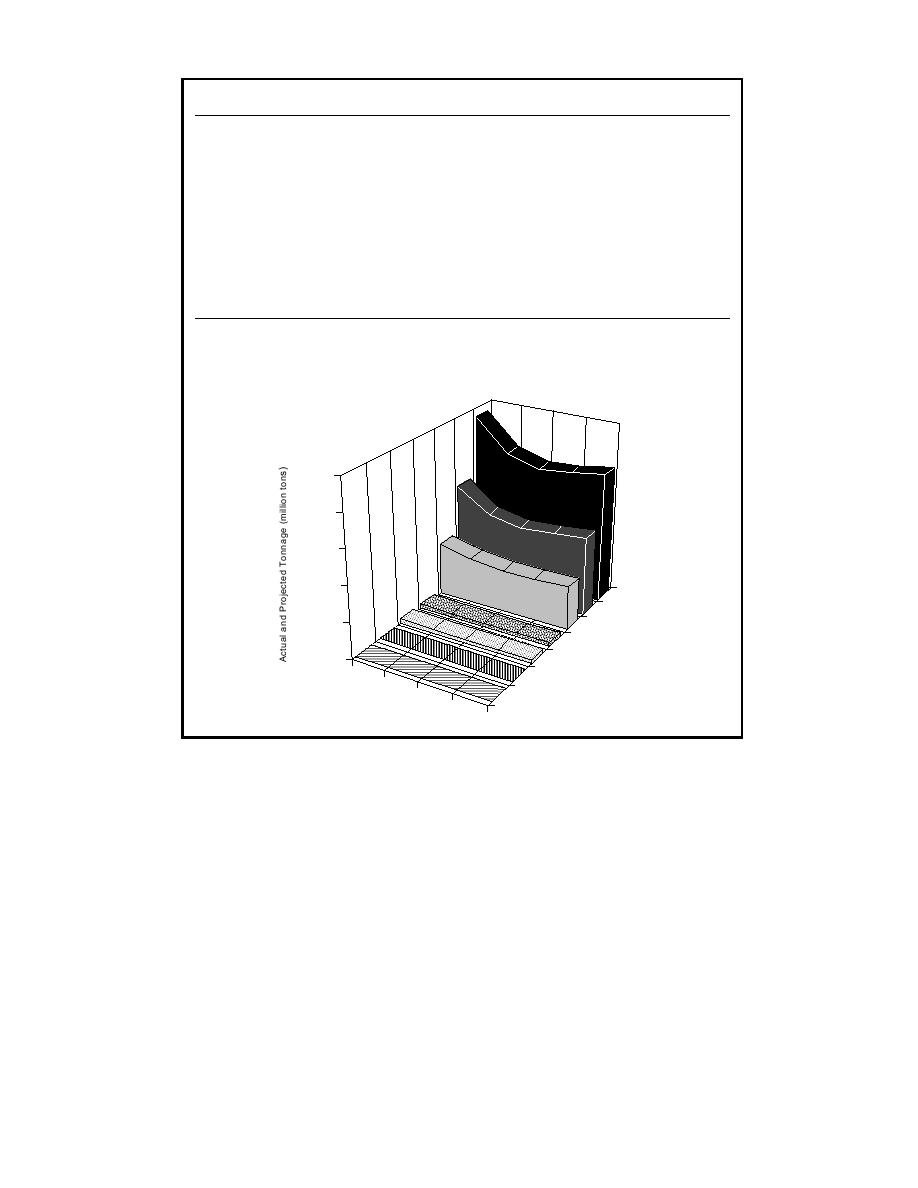
Figure 9. Actual and projected tonnages of Russian freight, in million of tons (mt) by various
transportation modes (from Holt 1993).
the majority of all freight, waterways are the pri-
North America, and Australia, Japan, and South
mary mode in certain regions where other means
Korea. Exports went mainly to Italy, The Nether-
are not practical. In some relatively isolated re-
lands, Great Britain, and Spain, while imports ar-
gions, it is the only mode available. The water-
rived mainly from Canada, France, and Japan. The
borne sector is vitally important throughout north-
next largest group of trading partners (11%) was
ern Siberia, since the highway and railroad systems
composed of developing countries, with India
have not extensively penetrated into this area.
alone accounting for more than 54% of trade with
Siberia's navigable waterways are approximately
this group. A further 9% is traded with nations of
four times the length of its railroads and eleven
the FSU, and less than 5% is traded with other
times longer than its road system.
socialist countries such as North Korea, China, and
Russia's international sea-trading partners are
former Yugoslavia. These statistics reveal that Rus-
primarily (76%) developed Western and Far East-
sia generally exports raw materials and imports
ern nations, such as those of Western Europe and
finished goods.
19


 Previous Page
