(Btu/hr-ft) (W/m)
140
140
120
120
100
100
80
80
60
CEGS - 02695
60
Q Soil 7.5
Insulation
40
40
J
F
M
A
M
J
J
A
S
O
N
F
M
A
M
J
J
J
F
M
A
M
J
1989
1987
1988
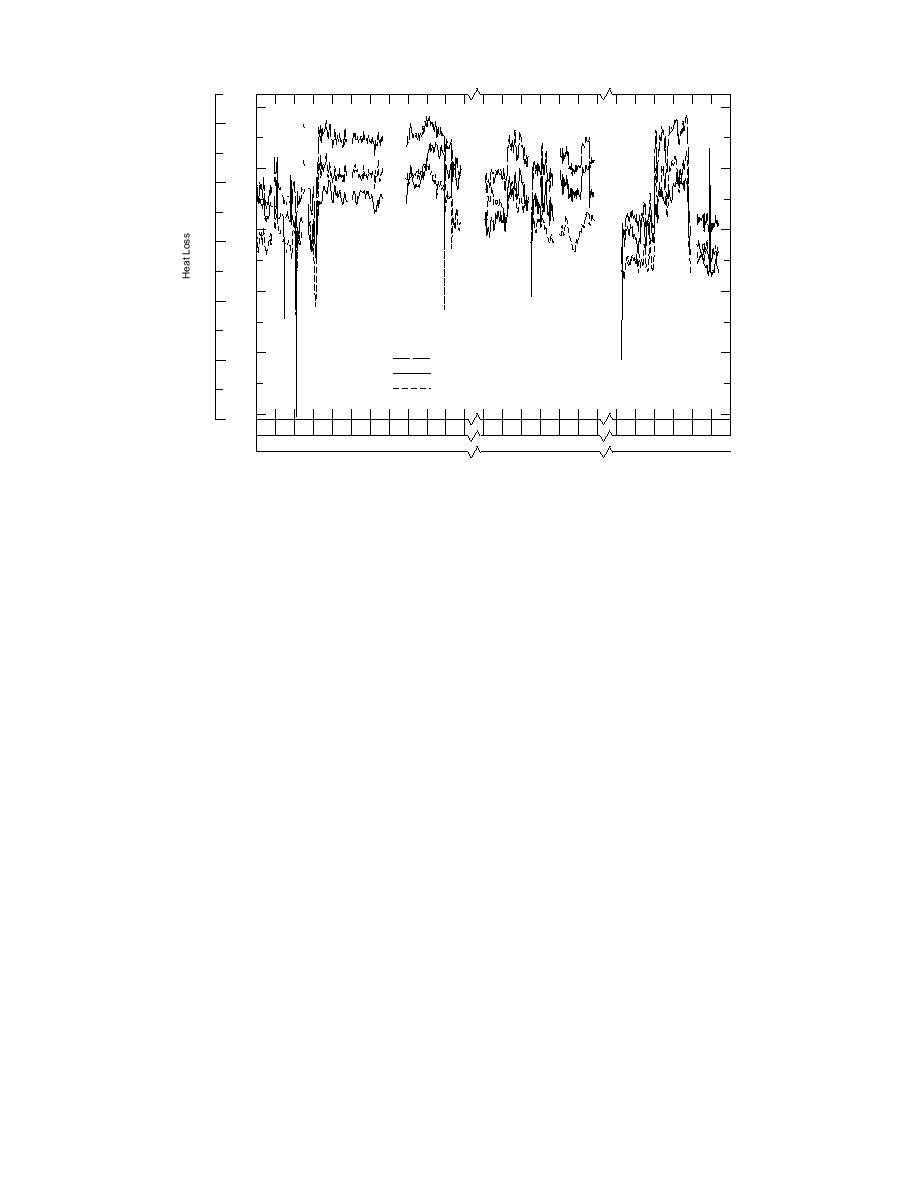
Figure 11. Heat losses from the MTHW common conduit site.
may have conservative assumptions (in that they
well. This will reduce the thermal resistance of the
would under-predict the actual thermal resistance)
soil in an absolute sense as well as relative to the
regarding the heat transfer across the air space, as
other thermal resistances in the system. Presum-
discussed in Phetteplace (1991b).
ably the other thermal resistances remain fairly con-
The heat losses for the entire study period for the
stant year-round, notably the insulation thermal
common conduit site are shown in Figure 11. Note
resistance which is much greater than the thermal
that during the early spring (around March), for
resistance of the soil or any other thermal resistance
each of the three years that we have data during this
in the system. Thus, the overall thermal resistance
time period, the results from the insulation method
will be reduced by a much smaller relative amount
increase to a value greater than those for the soil
than the soil thermal resistance. With the lower
method. Some time during the fall (about mid-Sep-
thermal resistance the temperature drop across the
tember for 1987, the only year for which we have
soil from the conduit casing to the ground surface
data during this time period) the trend is reversed.
will decrease relative to the other temperature drops
The soil moisture content offers one possible expla-
in the system. However, we have assumed that the
nation for this. Soil samples taken for this study
thermal conductivity of the soil is constant year-
(Phetteplace et al. 1991) indicate that the soil mois-
round in our soil method, and thus with the lower
ture content is higher during the spring and sum-
actual resistance and relative temperature drop mea-
mer than in the winter. One plausible explanation
sured we will underpredict the heat flow.
for this would be that it takes a considerable length
of time for the winter precipitation to diffuse into
MTHW individual conduit site
the low-permeability soil found at Ft. Jackson. Sub-
At the individual conduit site, the temperature
sequently the soil dries out slowly during the sum-
of the supply during the study period averaged
165.3C (329.6F) and the return averaged 111.6C
mer reaching its lowest moisture content in the fall
(232.8F) for the same period of time. The tempera-
and winter.
If the moisture content of the soil around the
ture of the outer surface of the conduit averaged
28.7C (83.6F) for the supply and 28.1C (82.5F)
conduit, particularly that between the conduit and
the ground surface, increases during the spring and
for the return. The undisturbed ground tempera-
summer months, then the thermal conductivity of
ture at approximately the same depth as the
centerline of the conduit averaged 14.3C (57.3F).
the soil will increase during that time period as
19


 Previous Page
