(Btu / hr - ft) (W / m)
35
36
32
30
28
25
24
20
20
Soil Method
I
nsulation Method
16
15
06 - 01 - 89
12 - 01 - 89
06 - 01 - 90
12 - 01 - 90
06 - 01 - 91
12 - 01 - 91
Date
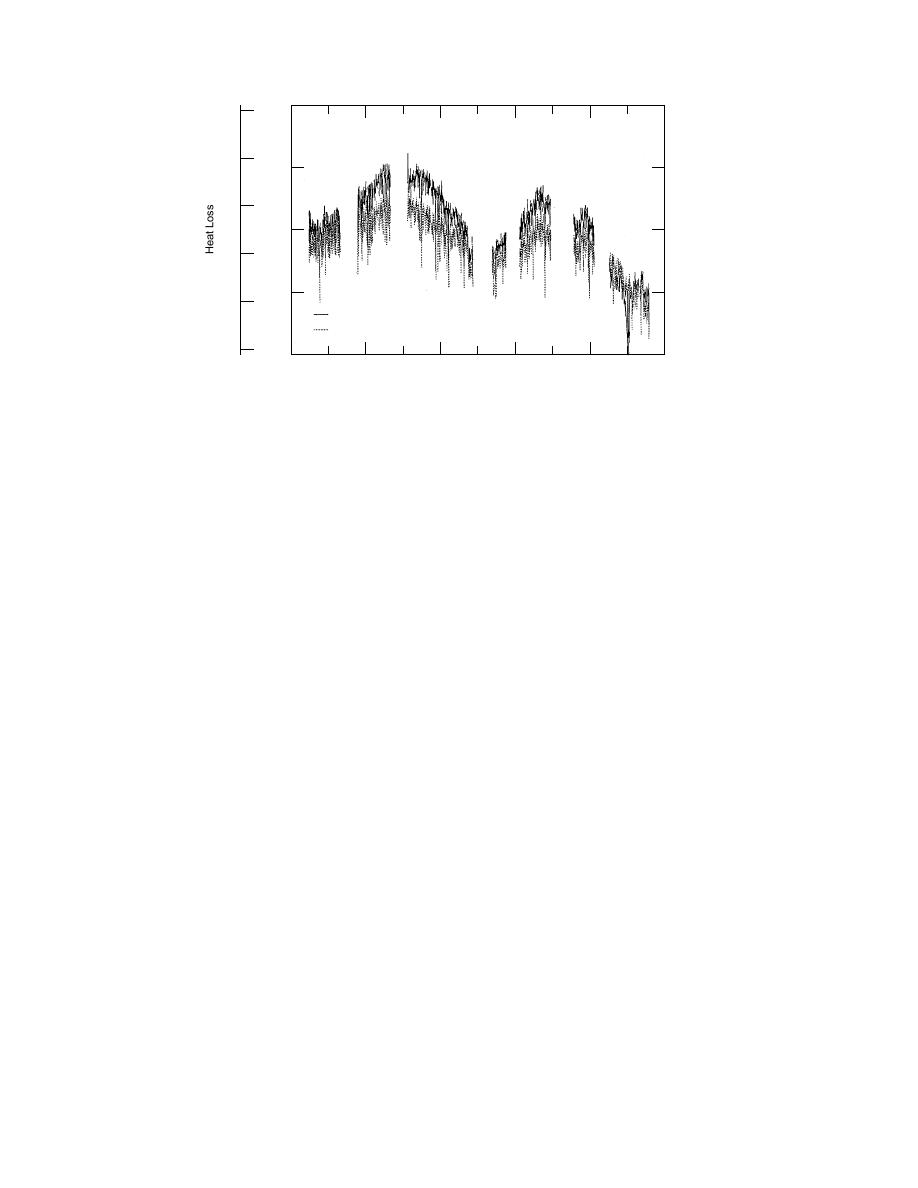
Figure 14. Heat losses from the LTHW site 2 system.
the supply and return piping is approximately
Conclusions drawn from
150 mm (6 in.) in diameter with approximately 32
heat loss measurements
The objective of our heat loss studies has been
mm (1.25 in.) of polyurethane foam insulation.
to achieve some insight into several aspects of
The average value of the heat loss from this sys-
thermal analysis of heat distribution systems. Of
tem using the two methods of measurement de-
primary importance is the actual rate of heat losses
scribed earlier is about 37.5 W/m (39 Btu/hr-ft).
from operating heat distribution systems. We have
For the medium temperature hot water system at
presented several years of data for five different
Ft. Jackson, South Carolina, the common conduit
sites on four types of heat distribution systems. In
site has approximately 125-mm (5-in.)-diameter
all but one case these heat losses have been mea-
supply and return piping with about 38 mm (1.5
sured under actual field conditions by more than
in.) of mineral wool insulation. The heat losses of
one method. By making heat loss calculations us-
this system average 108.6 W/m (113 Btu/hr-ft)
ing several different methods using independent
using the average of the three different methods
measurements, we have established the validity
of measurement described earlier. With proper
of our techniques for systems similar to those
design, the 150 mm (6-in.) low temperature pip-
studied. The methods used to make these mea-
ing is able to convey as much heat as the 125 mm
surements have proven to be very reliable and
(5-in.) medium temperature water piping. An ex-
repeatable. In general, agreement between meth-
ample of the heat carrying capacity is given in
ods has been very good in terms of the magnitude
Phetteplace (1992). Thus, the losses are reduced
of the heat losses as well as the trends over the
by a factor of nearly three. To put this in per-
yearly cycle.
spective, consider what this would do to the heat
The relative levels of heat losses found in our
losses from the Army's 5600 km (3500 mi) of heat
studies give rise to some significant conclusions re-
distribution piping (U.S. Army 1992). At 108.6
garding the cost of heat losses for the DoD and our
W/m (113 Btu/hr-ft) and .48 per GJ ( per
ability to impact these costs. We can use these re-
million Btu) the annual cost of heat lost would be
over 2 million. For 37.5 W/m (39 Btu/hr-ft)
sults to make an estimate of heat loss costs for DoD
and the same cost of heat the annual cost of heat
and also the savings which could be achieved by
losses would be about million. Thus, the Army
converting our high temperature water and steam
could save nearly 0 million per year from heat
systems over to low temperature hot water.
that is now lost to the environment. This assumes,
As an example, consider the reduction in heat
of course, that all the existing systems have rates
losses possible with low temperature water as
of heat loss similar to those of the Ft. Jackson
illustrated by some of the measurements taken on
system. Assuming that the size of the Ft. Jackson
the Ft. Irwin system. At one of the Ft. Irwin sites
22


 Previous Page
