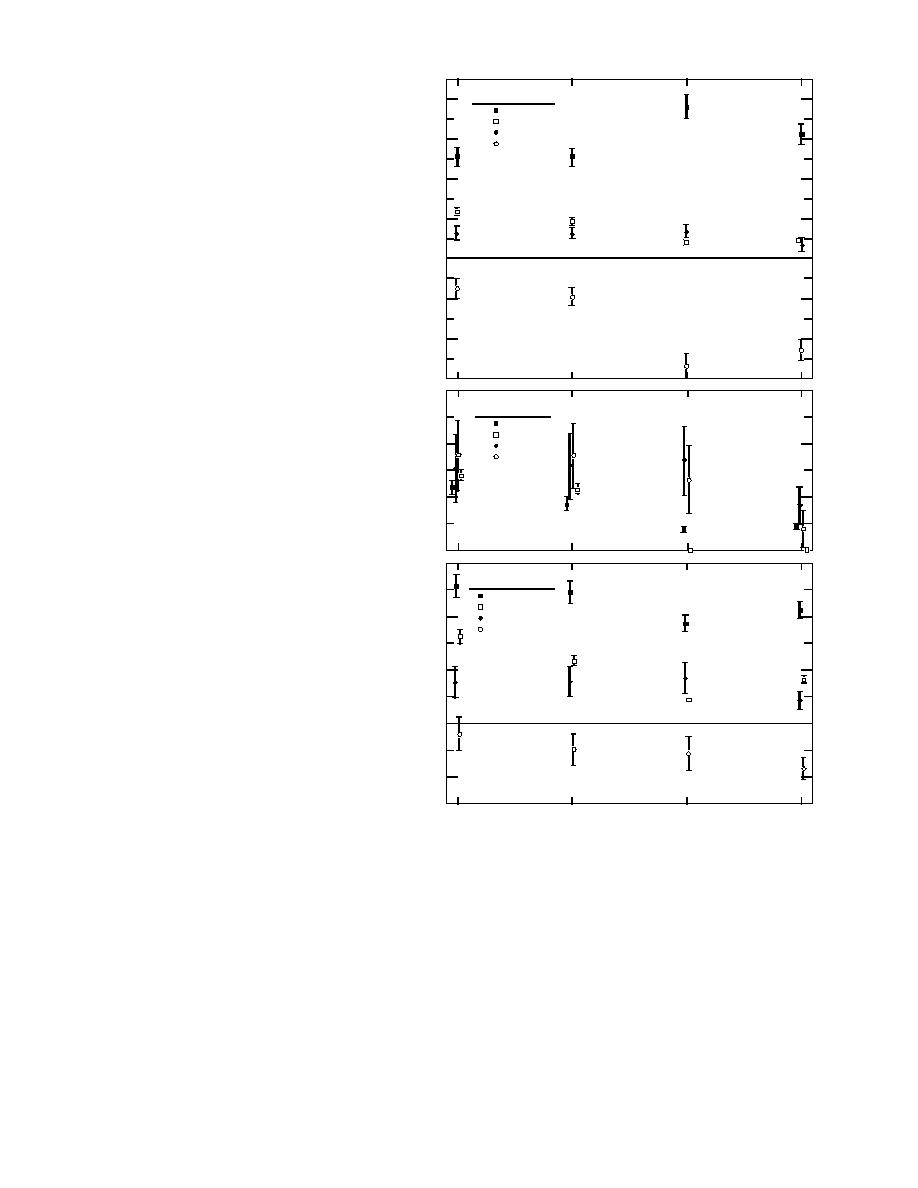
Results for each main-stem sub-
Crawford-Oglala
0.8
basin are detailed in Figure 6 for 1978
Qcraw
79, the coldest winter of the study. The
Qogla
Qice
ice production was consistent over the
0.6
Q sub
winter except for a drop in February,
with increasing mean and variance in
0.4
the downstream direction. The mean
subbasin flow exchanges were consis-
0.2
tently negative for Crawford to Oglala
Q
(m 3 /s)
and Kadoka to Oacoma, but positive
0
Qsub are generally comparable to or
larger than the river flows at the gages
0.2
for this entire winter. Figure 7 gives
corresponding results for 197980,
0.4
another low-flow winter with only
average air temperatures. The flow
0.6
storage due to ice growth was reduced
0.6
somewhat compared with 197879,
Oglala-Kadoka
but subbasin yields to the river were
Qogla
Qkado
generally comparable. Water storage
0.4
Qice
Q sub
as ice must be considered in a winter
Q
(m 3 /s)
water balance for semiarid regions, but
extreme cold may not significantly al-
0.2
ter basin hydrologic response. In both
tained for all the main-stem subbasins
0
3.0
are large compared to Qint calculated
Kadoka-Oacoma
by Rothrock (1942), in support of our
Qkado + WR
assumption that the net groundwater
Qoaco
Qice
2.0
exchange between subbasins is negli-
Q sub
gible.
The CrawfordOglala subbasin had
Q 1.0
only 3 of 28 months with a net inflow
(m 3 /s)
to the river: February 1976, the month
of maximum ice melt in the period
0
with relatively high flows indicating
runoff throughout the basin, and two
months in the 197980 winter. Exclud-
1.0
ing the four highest inflow months,
the mean Qsub for the period was
Nov
Dec
Jan
Feb
0.318 m3/s with a standard devia-
Figure 6. Winter 1978-79 monthly flows at main-stem White River
tion of 0.125 m3/s. The only peren-
gages, water storage as ice, and subbasin inflow for the reaches be-
nial stream in the reach is White Clay
tween the gages.
Creek. To obtain Qgw the analysis was
repeated with Crawford plus White
Clay Creek providing Qin. With this change the
sistently positive inflows. The three large inflow
correlation between reach inflow and outflow in-
months were the melt in February 1976 and
creased from 0.409 to 0.721. The mean Qgw ob-
prefreezeup combined with relatively high pre-
3/s, with a standard devia-
tained was 0.483 m
cipitation in November 1977 and 1979. The months
3/s. Groundwater recharge occurs
tion of 0.091 m
of small local inflows were those with low flows
consistently at a steady rate during winter and
at both gages and minor ice production. Exclud-
represents a significant flow loss from the river.
ing the four highest inflow months, the overall
mean Qsub was 0.39 m3/s, with a standard devia-
The OglalaKadoka subbasin produced con-
10


 Previous Page
