16
7
Crawford-Oglala
6
12
5
4
8
3
2
4
1
0
0
0.6
0.5
0.4
0.3
0.2
0.06
0.08
0.10
0.12
0.14
0.16
0.18
0.20
0.22
3
3
Oglala-Kadoka
2
2
1
1
0
0
0
0.2
0.4
0.6
0.3
0.4
0.5
0.6
0.7
0.1
0.2
1.2
1.4
Kadoka-Oacoma
1.2
1.0
0.8
0.8
0.6
0.4
0.4
0.2
0
0
0.2
0.4
0.6
0.8
1.0
1.2
1.4
1.6
1.8
1.2
0.8
0.4
0
3 /s)
Q sub (m 3 /s)
Q ice (m
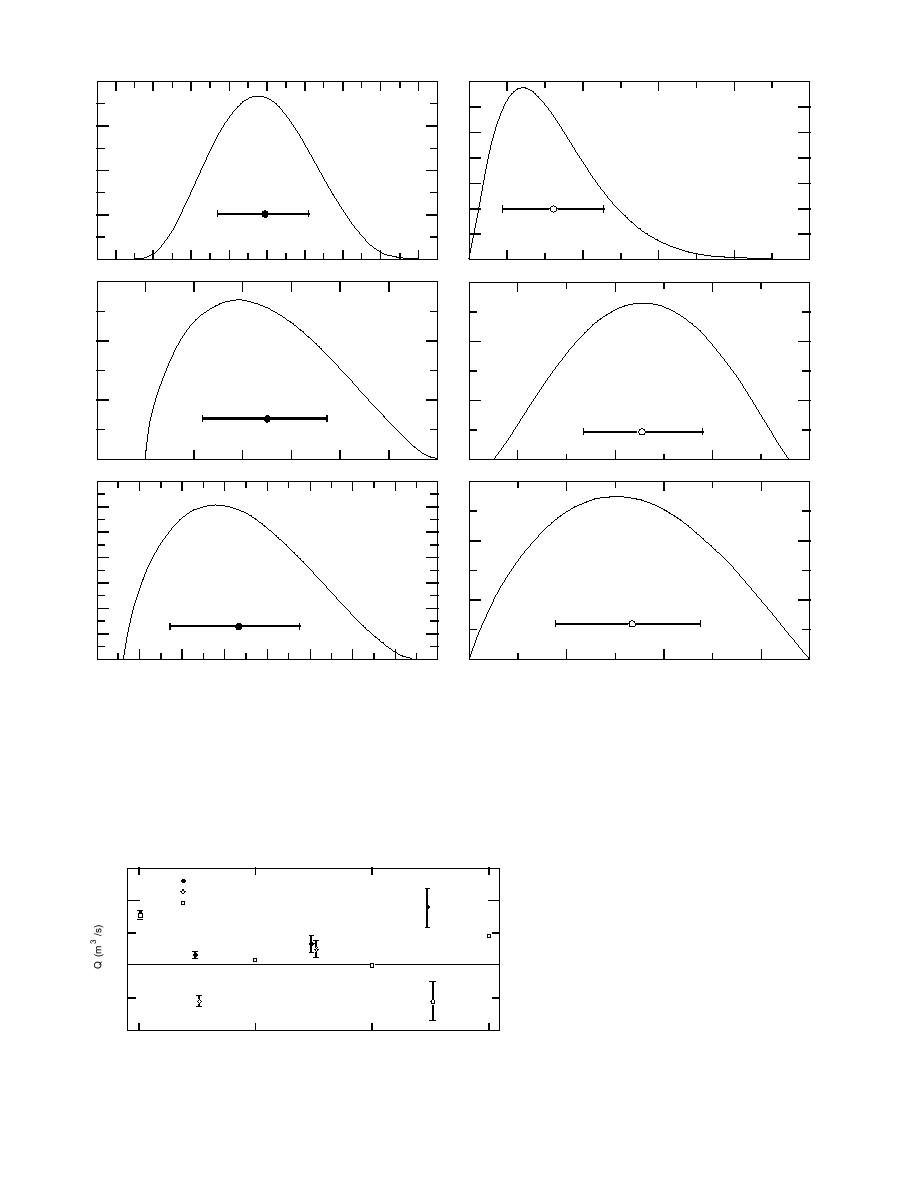
Figure 4. Beta distributions with means and standard deviations indicated for water storage as ice and subbasin inflow in
January 1979, by reach between main-stem White River gages. Positive Qice is water loss due to ice growth, and positive Qsub is
flow to the river from the subbasin.
1.5
Qice
Qsub
1.0
Qgage
0.5
0
Figure 5. January 1979 monthly flow at main-
stem White River gages, water storage as ice,
0.5
and subbasin inflows of the reaches between
gages. Both the mean and standard deviation are
1.0
given for each parameter.
Crawford
Oglala
Kadoka
Oacoma
9


 Previous Page
