(Tm - Ta )
2 x10 3
1
dh
=
(1)
WHITE RIVER
Annual Mean
dt ρiL h
h
1
Winter Mean
+
+ s
k H
ks
Little
ia
White River
1
where h and hs are thicknesses (m) of the ice and
its snow cover, t is time (s), k and ks are thermal
conductivities of the ice and snow (W/m C), L is
the latent heat of fusion (J/kg), ρi is the density of
Loss
Loss
0
CRAW
CR-OG
OG-KA
KA + LW-OA
ice (kg/m3), Hia is the iceair or snowair heat
810 km2
4890 km2
7300 km2
9300 km2
2 x10 3
transfer coefficient (W/m2 C), and Tm and Ta are
LITTLE WHITE RIVER
the ice melting point and air temperatures (C),
respectively. Integrating eq 1 and taking the posi-
tive root of the resulting quadratic equation, we
1
obtain the final or end-of-the-month ice thickness
hf as
1/2
2kTa ∆t
hf = (hi + hr ) -
2
- hr
0
(2)
VE-RB
MART
MA-VE
RB-WR
ρiL
800 km2
700 km 2
1140 km2
1430 km 2
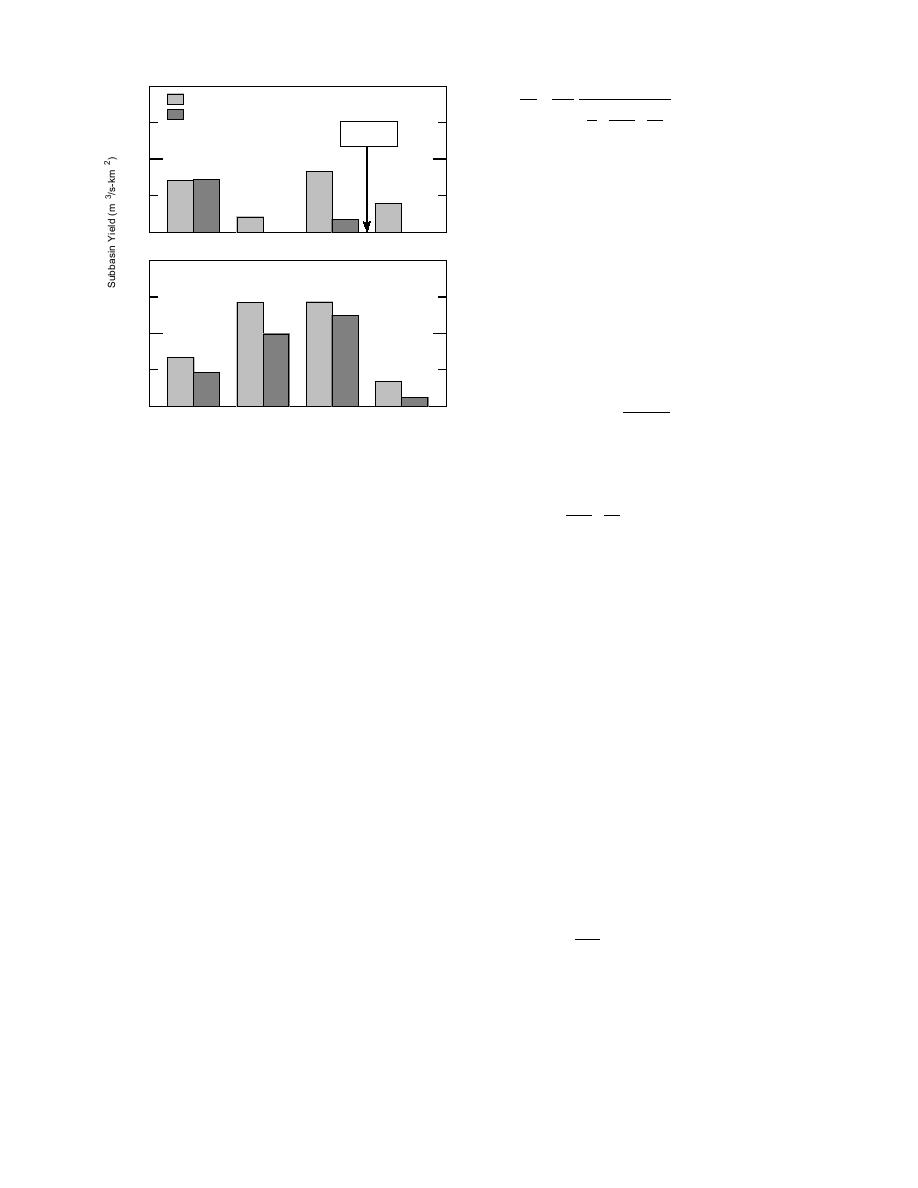
Figure 2. Annual and winter average water yields for the
where
period of record in sequential subbasins of the White River
basin.
1
hs
hr = k
+ ,
Hia ks
hydrogeologic maps of Ellis and Adolphson
(1971) and Ellis et al. (1971) support the conclu-
hi is a given initial or start-of-the-month ice thick-
sion that the primary reason for the widely differ-
ness, and ∆t is the monthly time increment (s).
ing yields of the White River subbasins is differ-
The parameter hr in eq 2 represents an equivalent
ences in near-surface geology.
ice thickness corresponding to the thermal resis-
tance of the snow and the interface with the air.
The melting of a river ice cover can occur on
RIVER ICE GROWTH AND MELT
both the top and bottom surfaces. The heat sup-
plied by the water to the bottom surface becomes
The extreme low flows in winter on the main
dominant during ice breakup in the spring as the
stem of the White River greatly increase the im-
area of open water upstream becomes large
portance of water storage as ice in the water bal-
(Prowse 1990). However, in the early stages of ice
ance. We now develop a method to quantify the
melt when most of the river is still ice covered,
storage of water as river ice and its release as
the direct heat flux from the atmosphere to the
melt. A large number of processes occur during
top surface is dominant. We assume that ice melt
ice formation and growth in rivers that contrib-
during the winter period represents an "early
ute to variable ice thickness. For example, rapids
stage" of melt and that the snow on the ice at this
can remain open all winter, producing ice at a
time is negligible. These assumptions allow us to
high rate, while slower and deeper reaches situ-
use a simplified form of eq 1 to estimate the melt,
ated downstream can collect this ice and develop
and integration yields
thick deposits. However, we are interested in char-
acterizing ice growth at a monthly time scale over
Hia
long reaches of a shallow, mildly sloped river.
hf = hi -
Ta∆t .
(3)
ρiL
Therefore, we assume that these local, mechani-
cally induced variations in thickness occur about
a mean that is dictated by the air temperature
With hf known from either eq 2 or 3, we can
regime. The physically based air temperature in-
obtain the monthly average flow Qice that has
dex model of ice growth given by Ashton (1989)
gone into or out of storage as ice or melt:
is applied:
5


 Previous Page
