picted, a summer of groundwater withdrawals
sidered, a change of less than 2%. Similarly, a flow
and insufficient recharge has caused the water
decrease by a factor of 20 occurred at Kadoka
table to fall to a minimum by the end of October.
between October and November 1980. Mean sub-
basin inflow decreased from 0.24 to 0.02 m3/s with
The end of the irrigation season, together with
recharge from the river over the winter, causes a
channel storage included in the water balance.
recovery of the levels. By April the water table is
The direction of Qgw can be reversed by the chan-
at river level, and it continues to rise through June.
nel storage term for decreasing flow conditions.
After that time groundwater discharge and with-
drawals cause the levels to fall, reaching river
level in July and continuing down with sustained
HYDROLOGIC IMPLICATIONS
withdrawals toward the fall minimum. A plot of
flow loss from the perched river is depicted in
The winter hydrologic balance is useful for de-
Figure 9, together with the mean annual hydro-
termining flow quantities and directions, but in-
graph of the White River at Oglala. With a perched
sights on the annual exchanges would be very
river, the winter flow loss extrapolated through
important. The balance between groundwater con-
the year would provide a lower-bound estimate
sumption and recharge determines the long-term
of annual groundwater recharge from the river.
availability of the resource. Conversely, increased
The case of a coupled hydrologic system is de-
flow losses from the river affect water quality,
picted in Figure 10. "Net groundwater loss" in
aquatic habitat, and surface water availability. Fig-
this figure is the withdrawal restricted to the pe-
ure 8 depicts the possibilities for a near-surface
riod with the water table at or below river level.
aquifer that is recharged by the river during win-
ter. The first has the river perched above the wa-
As drawn, the flow loss in winter is nearly equal
to the annual river flow loss. An extrapolation of
ter table throughout the year, resulting in a con-
the winter losses provides an upper bound for
tinuous loss of water from the river by unsatur-
recharge from the river.
ated flow. For given alluvial bed conditions the
The net yield per square kilometer of a subbasin
flow loss would be proportional to the wetted
or the net flow loss per square meter of channel
perimeter and depth of the river, each generally
bed of three main-stem reaches are given in Table
increasing with river flow. The other possible con-
3 for relatively dry months (January 1977 and 1979)
dition is a coupled streamaquifer system, with a
and wet months (February 1976 and November
fluctuating relationship between river and ground-
1977). Tributary inflows considered apart from
water levels throughout the year. In the case de-
Qgw
June
Water
Table
April, July
er
Octob
Water
River
Tab
hed
le
Perc
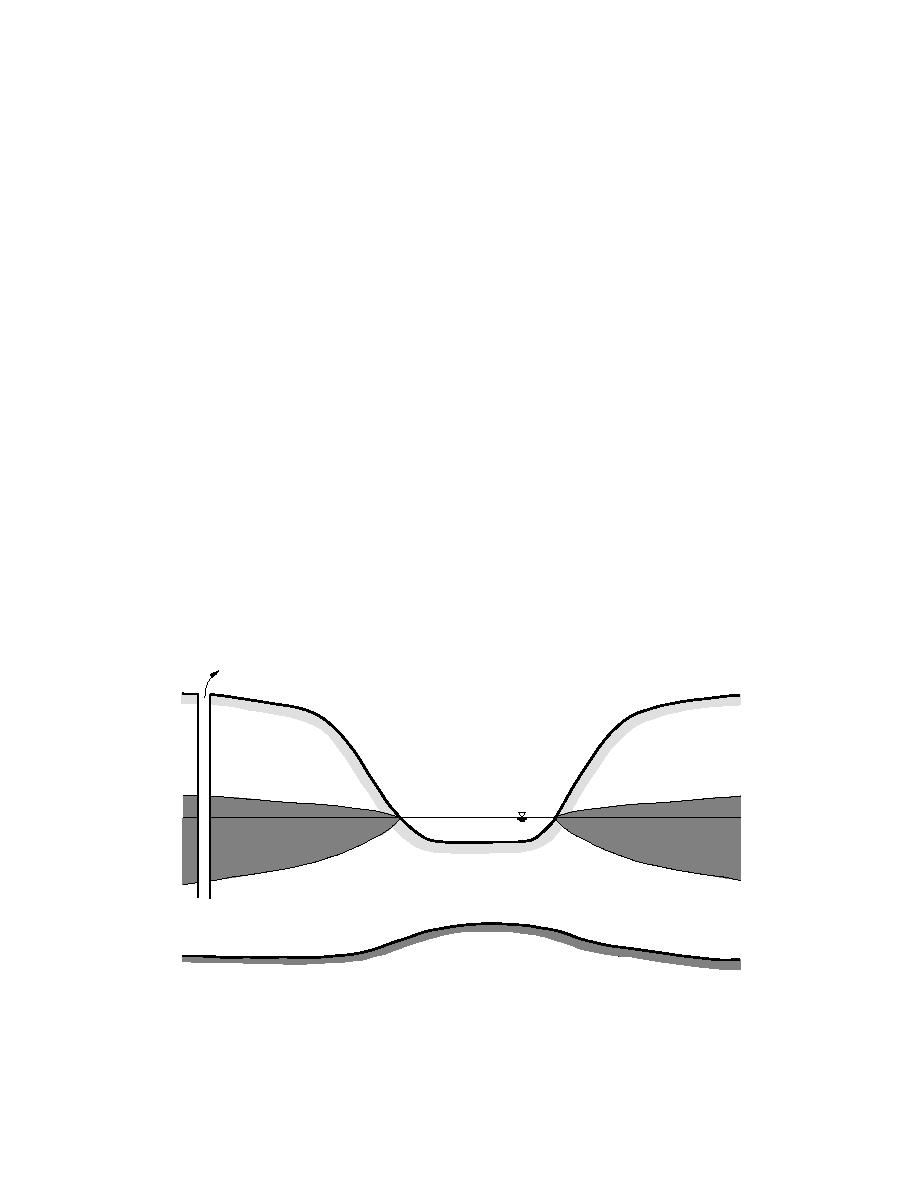
Figure 8. Schematic diagram of a river that recharges the groundwater during winter. Ground-
water withdrawal is indicated. The river may be perched above the water table or directly connected
to the water table in a coupled hydrologic system. Water tables in the diagonal shading discharge to
the river, and those in the vertical shading or below are recharged by the river.
12


 Previous Page
