Two of these creeks were gaged in 199293,
0.6
Crawford-Oglala
having a combined winter flow 1.7 times that
Q craw
of White Clay Creek. We use two times the
Q ogla
0.4
White Clay Creek flow as a conservative esti-
Q ice
Q sub
mate of tributary inflow to this reach. The over-
0.2
all mean Qgw was obtained, again excluding
Q
(m 3 /s)
the four high inflow months, as 0.11 m3/s with
0
a standard deviation of 0.31 m3/s and 12 nega-
tive mean inflow months. The riverground-
0.2
water exchange in either direction near Kadoka
is consistent with Rothrock (1942), but a more
0.4
quantitative understanding will require addi-
tional tributary flow data.
Oglala-Kadoka
The monthly subbasin inflows on the Little
1.2
Q ogla
White River above Rosebud are always posi-
Q kado
Q ice
tive. The mean inflows downstream of the Rose-
Q sub
1.0
bud gage are usually positive, but there is a
significant probability of negative inflows for
almost all months of the study period. These
Q 0.8
(m 3 /s)
significantly reduced subbasin yields to the river
represent a transitional behavior between the
0.6
high yields of the Little White basin upstream
and the low yields of the White River subbasin
immediately downstream. The Little White
0.4
River inflow to the KadokaOacoma reach is
typically much greater in winter than the White
0.2
River main stem flow at Kadoka. Significant
positive subbasin inflows to this furthermost
downstream White River reach were computed
0
for February 1976, November 1977, and No-
vember 1979, the same months as the adjacent
Kadoka-Oacoma
subbasin upstream. However, the local monthly
3.0
Q kado + WR
subbasin inflows are again generally negative
Q oaco
Q ice
in the winter. Flow losses in 7 of 28 months
Q sub
exceeded 1.1 m3/s, with a maximum loss of 2.5
2.0
m3/s. Neither the coldest months nor those
Q
(m 3 /s)
with maximum ice growth correspond to
1.0
months of maximum flow loss from this reach.
We now consider the assumption of negli-
0
gible channel storage in the water balance. For
most of the seven study winters, the change in
average flow of consecutive months was small
1.0
throughout the basin, and Qst could be ne-
glected without significant error. The largest
Nov
Dec
Jan
Feb
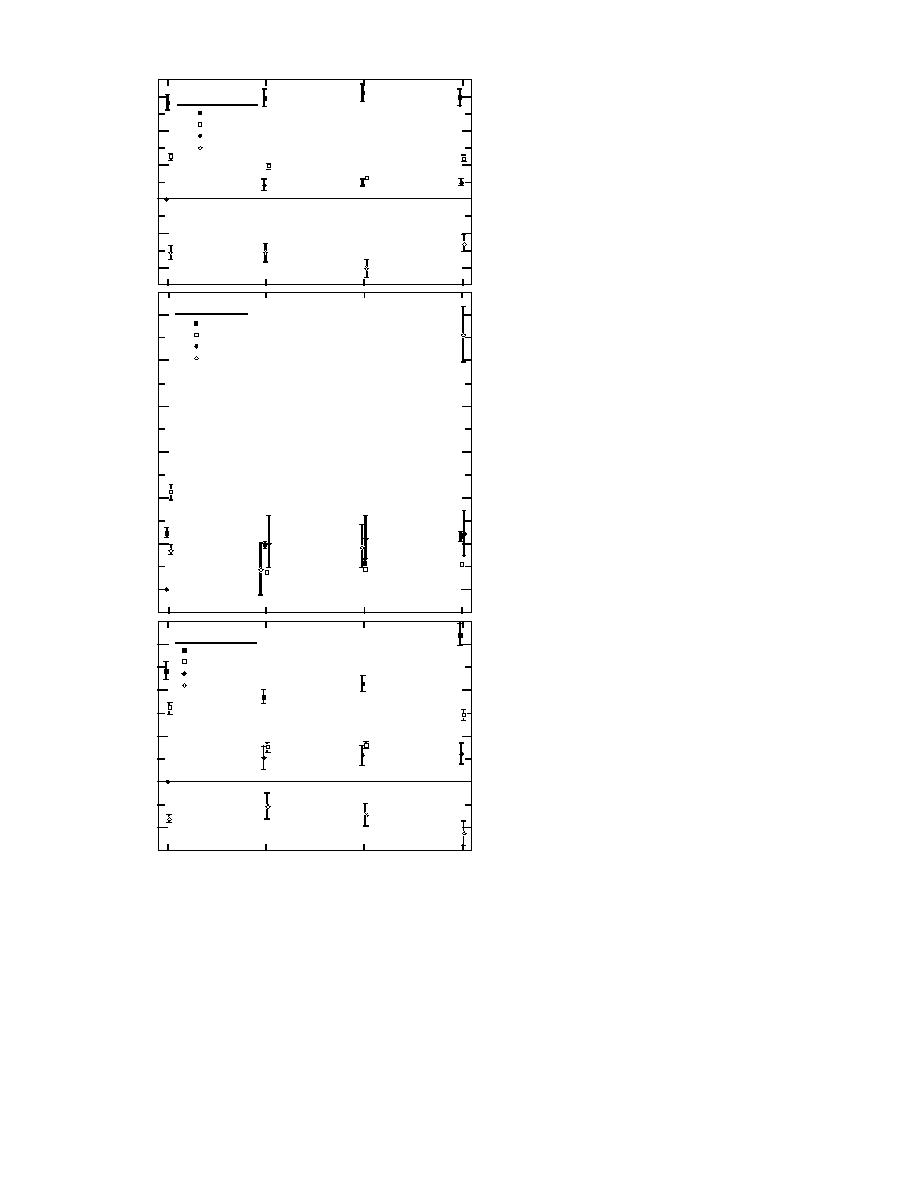
Figure 7. Winter 197475 monthly flows at main-stem White flow increase of the study period on the main-
River gages, water storage as ice, and subbasin inflow for the stem White River occurred between January
1976, a cold, low-flow month, and February
reaches between the gages.
1976, a month of significant melt, runoff, and
relatively high flow. The consecutive monthly
3/s and all positive monthly means.
tion of 0.32 m
flows at Oglala and Kadoka increased by factors
The rivergroundwater exchange in this reach is
of 8 and 29, respectively. We obtained Qst using
clearly different from that in the adjacent subbasin
USGS gage rating data from these months. The
upstream, but the quantity and direction are
mean subbasin inflow to the river increased from
9.55 to 9.71 m3/s when channel storage was con-
masked by inflow from three perennial creeks.
11


 Previous Page
