rafted ice field. Interestingly there appeared to
be little difference in the forces exerted on the ice
Lake Huron
control structure during upbound and down-
bound passages. The conclusion that loads ap-
plied to the ice boom are independent of vessel
direction was also made for the St. Marys River
Lake
Chipican
ice boom (Perham 1978b). The dynamic loading
of the ice control structure during vessel passage
was expected to average three to five times greater
than the static load.
The effects of wind stress on the ice cover were
examined in a follow-on study of a Port Huron
Point Edward
ice control structure (Sodhi et al. 1982). Here water
flowing beneath the model ice was used to simu-
late wind blowing over an ice cover. The ice was
restrained by two configurations of barriers, which
N
were instrumented for forces. One was a large
funnel arrangement simulating the Lake Huron
shoreline near Port Huron, and the other was a
Port Huron
much smaller inverted funnel simulating an ice
control structure.
Tests of ice releases resulting from ship tran-
sits were conducted for both upbound and
downbound passages and for different ice con-
trol structure orientations. Sodhi et al. (1982) con-
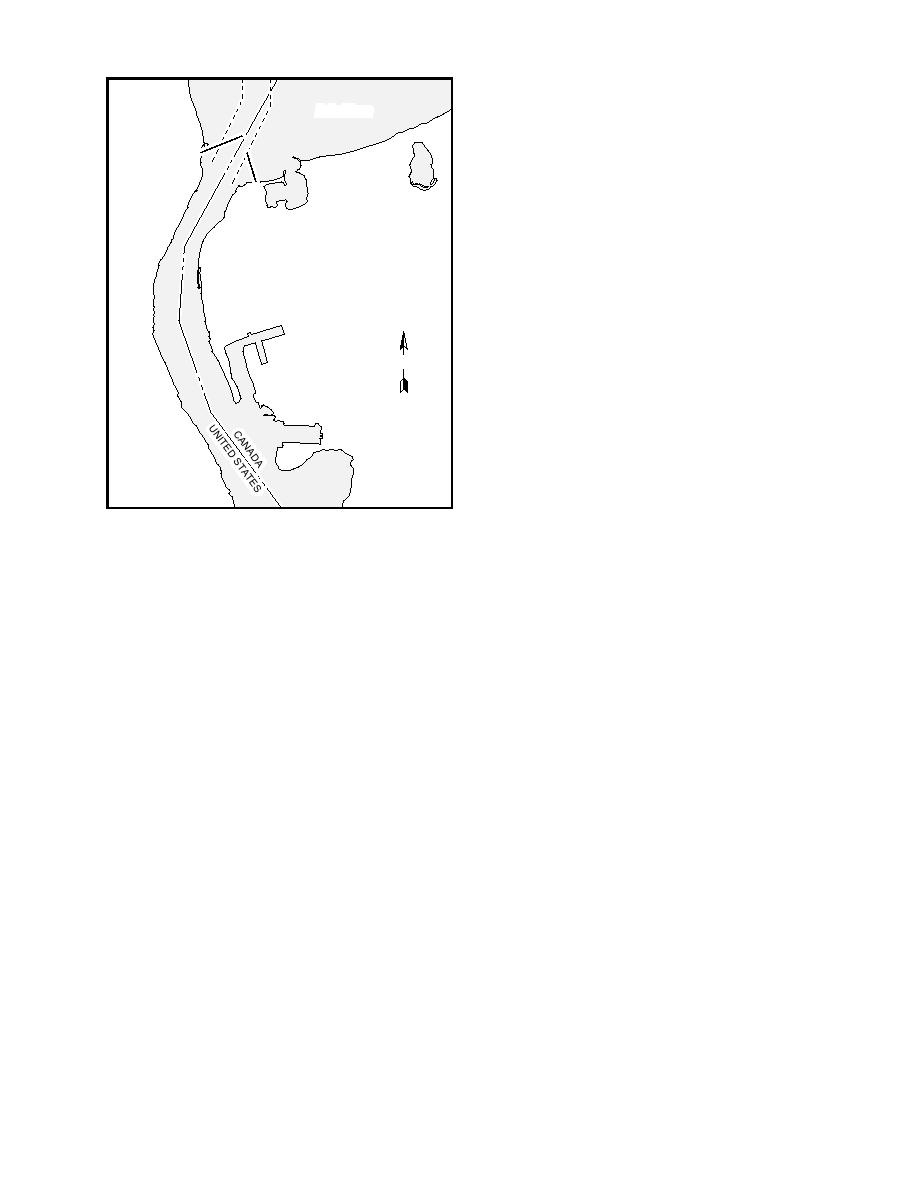
Figure 21. Location of the Port Huron ice control struc-
cluded that the ice cover could arch across the
ture. (After USACE 1979a.)
navigation gap at values of a/b ranging from 0.11
to 0.15, or 44 to 60 ft at the proposed gap width
covering approximately a 1-mile length of proto-
of 400 ft. Further, the mean value of ice area re-
leased per vessel passage, Ar/b2, would be less
type (Calkins et al. 1982). A wire-line-towed model
than 3 (or 480,000 ft2). Mean ice forces on the ice
ship of prototype dimensions 105 ft beam, 1000
ft long and 27 ft draft was used to represent ves-
control structure due to wind loading by a 40-mph
sel passages. Plastic ice floes of both random and
wind were estimated to be 380 lb/ft, with maxi-
square shapes, as well as natural ice, were used
mum forces of up to 1000 lb/ft of structure length.
in separate tests.
The model tests for an ice control structure at
The results of the testing program showed that
Port Huron were conducted near the end of the
ice passage through the gap was greater for square
Winter Navigation Demonstration Program. It was
floes than for random-shaped floes of comparable
never constructed nor even designed in detail. If
size and that for random-shaped floes the domi-
it were to be built at some future date, the design
nant variables affecting vessel-induced ice pas-
loads on the structure could be determined by
sage were the floe size/gap opening ratio, a/b,
superposition of the hydraulic and wind stress
and the direction of vessel passage. The average
forces estimated in the studies by Calkins et al.
ice discharge per vessel (in terms of ice area per
(1982) and Sodhi et al. (1982).
the square of the gap width, Ar/b2) varied from
0.1 to 1.0 depending on the floe size, with down-
bound transits causing greater ice releases than
ICE CONTROL AT LOCKS
upbound ones. The minimum a/b ratio for re-
A significant effort in the Winter Navigation
establishing a stable arch across the gap was ap-
Demonstration Program was to determine meth-
proximately 0.075 (or 30 ft for the proposed 400-
ods to minimize ice problems in and around navi-
ft gap).
gation locks. There are two sources for the ice that
The surface condition of the ice floes above
causes the problems: ice that simply freezes in
the ice control structure was also very important,
place and brash ice arriving at the lock from up-
as a non-rafted ice field allowed a two- to five-
stream. This section will review a number of con-
fold greater ice release per vessel transit than a
44


 Previous Page
