sion and provide a strength comparable to that
in the prototype. The ice cover would be broken
by radio-controlled scale models of a 20-ft-beam
by 700-ft-long or 105-ft-beam by 1000-ft-long pro-
totype, each having a 27-ft draft and a prototype
speed of 35 mph. The ship speeds monitored
during 125 vessel passages in ice averaged 9.7
ft/s (2.9 m/s) for upbound ships and 12 ft/s (3.7
m/s) for downbound ships (Perham 1978b). This
is significantly above the 4.4- to 7.3-ft/s proto-
type speeds employed in the model study by Acres
(1975) and may have influenced their results. In
his final, general report on the performance of
the St. Marys River ice boom, Perham (1984) in-
cluded information on forces that can be exerted
on the boom by vessel passage.
Open-water tests and ice-cover tests were run
to calibrate the hydraulic performance of the
model, followed by icebreaking tests to measure
ice losses without structures. It was found that
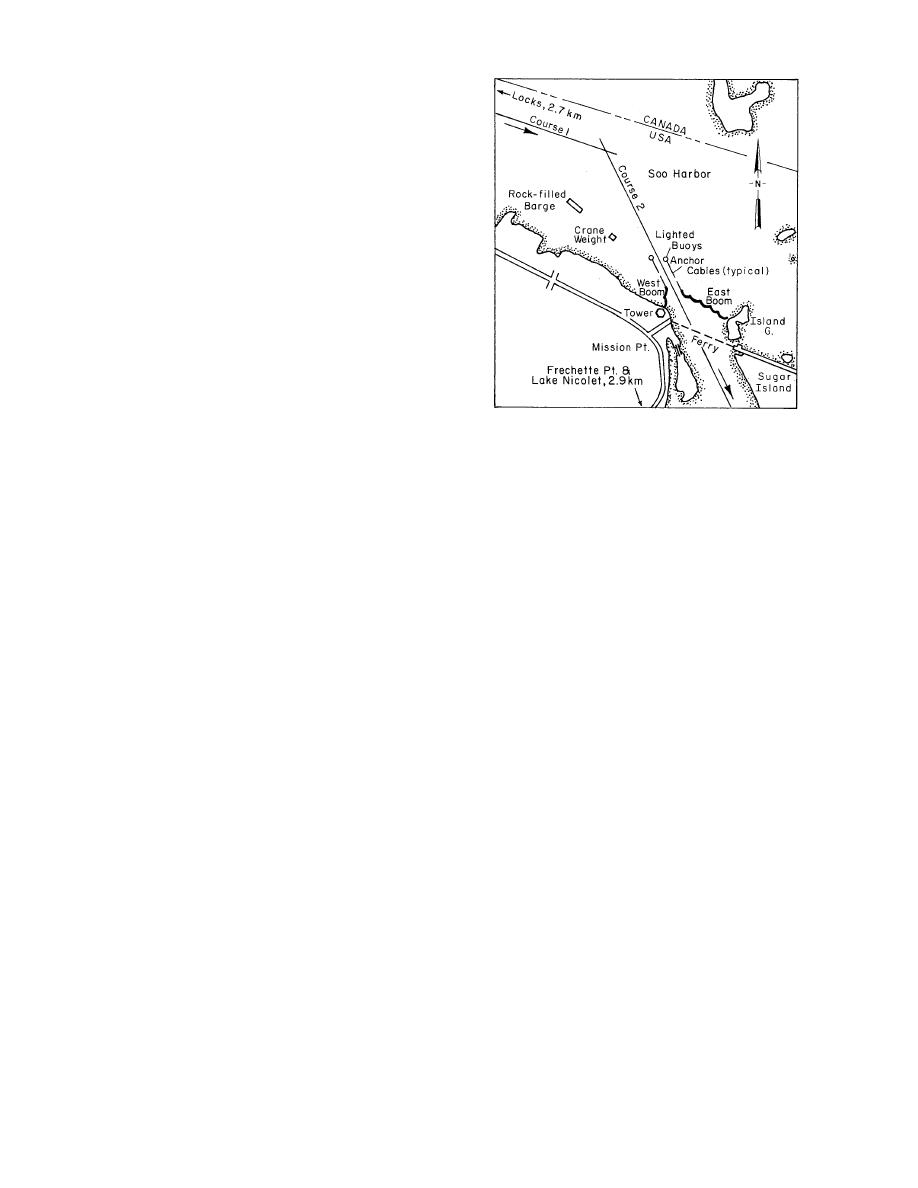
Figure 19. Location of the St. Marys River ice
the fracturing, movements and accumulations of
control structures. (From Perham 1984.)
the model ice cover simulated the effects seen in
the prototype very well.
The remedial measures evaluated in the model
(shown in Figure 19) had the best combination of
were lines of cells; lines of pile dolphins of vari-
location and structural element sizes, and it per-
ous lengths, spacings and locations; booms of
mitted ice losses averaging only 16,100 cubic yards
different lengths at different locations; and riprap
per ship passage, or an 80% reduction. The need
jetties. Navigation gap lengths through these struc-
for the two rock islands shown upstream of the
tures were also varied. An initial series of tests
ice booms in Figure 19 to provide additional sta-
produced a most promising structural arrange-
bility to the ice cover was recognized later, after
ment, which was then further evaluated to de-
the prototype structure had been installed for its
termine the proper location relative to the head
second winter of use (Perham 1978a).
The St. Marys River ice boom was designed in
of Little Rapids Cut, the navigation gap width
the summer of 1975 based on the best available
and the gap position relative to the navigation
information at that time. The forces on the ice boom
course centerline. Certain remedial measures such
would come mainly from the drag of water and
as ice harvesting (removal of excess ice), ice sup-
wind on the Soo Harbor ice cover and from the
pression (air bubblers) and ferry crossing reloca-
action of ships passing through the ice cover. Since
tion were analyzed and found to be impractical
the latter effect was practically unknown, the boom
(Acres American, Inc. 1975).
was instrumented so that forces could be continu-
A baseline ice production test with a river flow
ously monitored. A test program conducted the
of 75,000 cfs and no structural controls produced
previous winter at Copeland Cut on the St.
an average of 82,000 cubic yards of ice per ship
Lawrence River provided little guidance on ship
passage through Soo Harbor at prototype scale,
forces except that the forces can be attenuated
and ice pack thicknesses in the cut were estimated
almost completely by a solid ice cover bonded to
to be from 35 ft. Wide variations in ship-induced
shore (Uzuner 1975).
ice releases were observed.
The ice control structures, shown in Figure 20,
Tests of possible ice control structures included
are composed of 3 shore anchors, 13 river bot-
the application of wind forces to move ice into
tom anchors, 17 anchor cables and 7 boom cables.
and through lines of dolphins, and as a result
The boom cables are 250 ft long (76.2 m), and the
dolphin spacing had to be reduced for better re-
length-to-chord ratio is approximately 1.3:1. Each
straint. It was subsequently concluded that booms
timber is 1 ft 2 ft 20 ft long (0.30 0.61 6.10
were a better solution than dolphins. Based on
m long). A novel feature used at the upstream
these tests it was concluded that configuration F
41


 Previous Page
