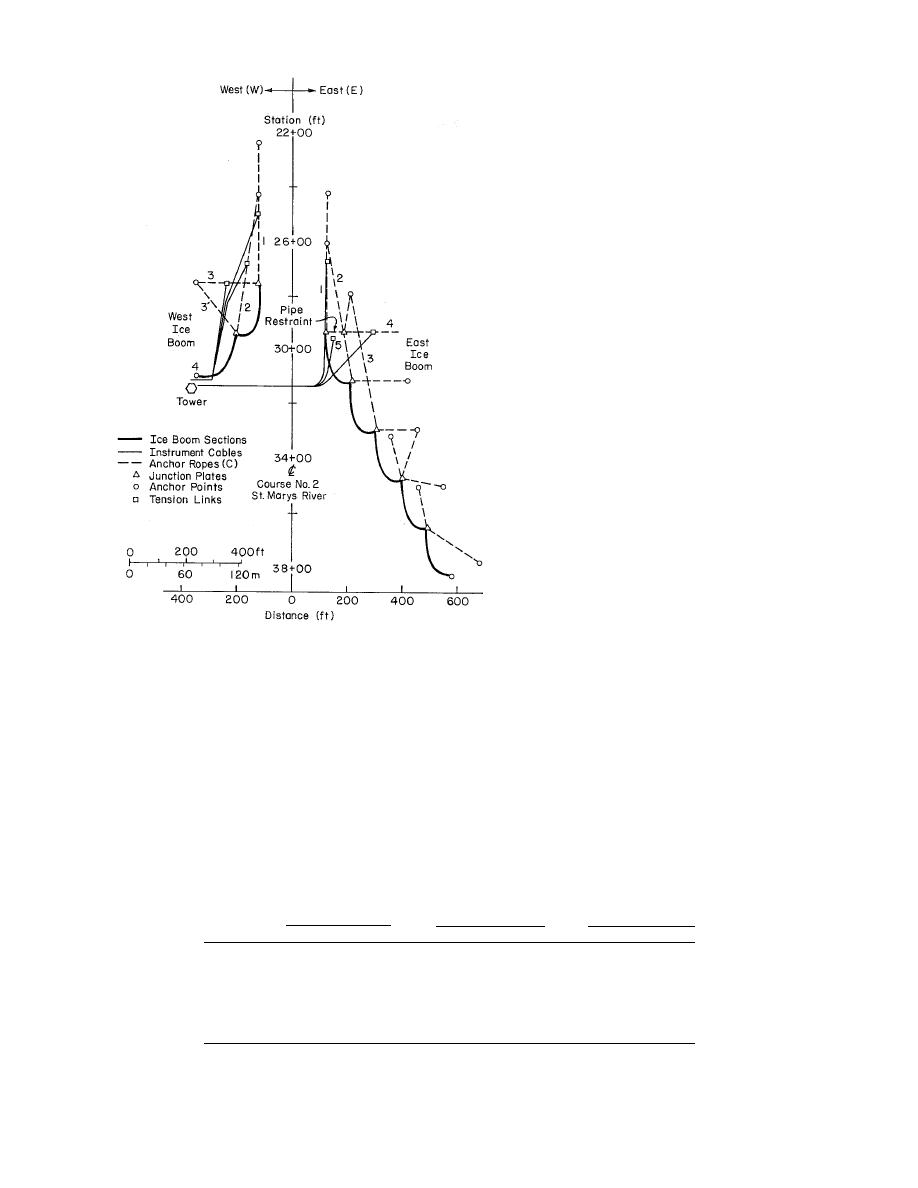
was observed that this ice sheet could break
free from the shoreline as a single sheet as
much as 1.5 miles in length and would ex-
ert forces sufficient to damage some of the
boom components. An additional anchor line
(3′ in Fig. 20) was added following the first
season to remedy the situation.
In January of 1977, however, two minor
cables (3 and 3′ in Fig. 20) as well as the
main shore anchor broke. Following the
incident, cables 3 and 3′ were strengthened,
and a 300-ton barge and six crane weights
totaling 95 tons were positioned in shallow
water upstream to help anchor the ice sheet.
In addition, a small ship has been used to
keep the ice sheet from freezing solidly to
the ice boom timbers. The highest recorded
boom forces occurred during the first two
seasons, indicating that the performance was
indeed improved by the anchor line modi-
fications and the addition of the barge and
crane weight ice anchors. While large ice
sheets could still break free between the
vessel track and anchors, the resultant forces
were not sufficient to damage the boom. The
temporary ice anchors were replaced with
rock islands in 1981.
The peak loads that developed in some
of the boom structures during the winter of
1976 are shown in Table 2. The anchor cables
are identified as being in the west or east
Figure 20. Details of the St. Marys River ice boom.
boom by the corresponding letter suffix on
the cable number and are shown in Figure
end of the east boom was a 60-ft-long floating
20. The expected load is the design load and
horizontal column used to transfer forces so as
was calculated for each of the components (Perham
to avoid putting an anchor line in the navigation
1977). The ice and ship effects on the booms dur-
openings.
ing the winter of 1976-77 were also published by
The study of the performance of the St. Marys
Perham (1978b). A noteworthy finding was that
River ice boom lasted for four years, ending with
there was little difference in peak force levels on
the Winter Navigation Demonstration Program
the boom between upbound and downbound
at the close of the winter 1978-79 season. During
ships, the force level being about 25,000 lbs.
the early years a problem developed due to the
Ice passage through the boom was also moni-
stability of the ice sheet above the west boom. It
tored. Ice release during periods that were busy
Table 2. Peak loads on the St. Marys River ice boom, 1976.
Tension link
Anchor
Expected load
Force recorder charts
design capacity
cable
(lbf)
(kN)
(lbf)
(kN)
(lbf)
(kN)
ClW
65,000
289
77,000
343
180,000
801
C2W
97,000
431
94,000
418
180,000
801
C3W
13,000
58
53,000
236
60,000
267
ClE
43,000
191
160,000
712
120,000
534
C4E
5,000
67
4,100
18
60,000
267
C5E
8,200
36
1,500
7
60,000
267
42


 Previous Page
