2
0
2
4
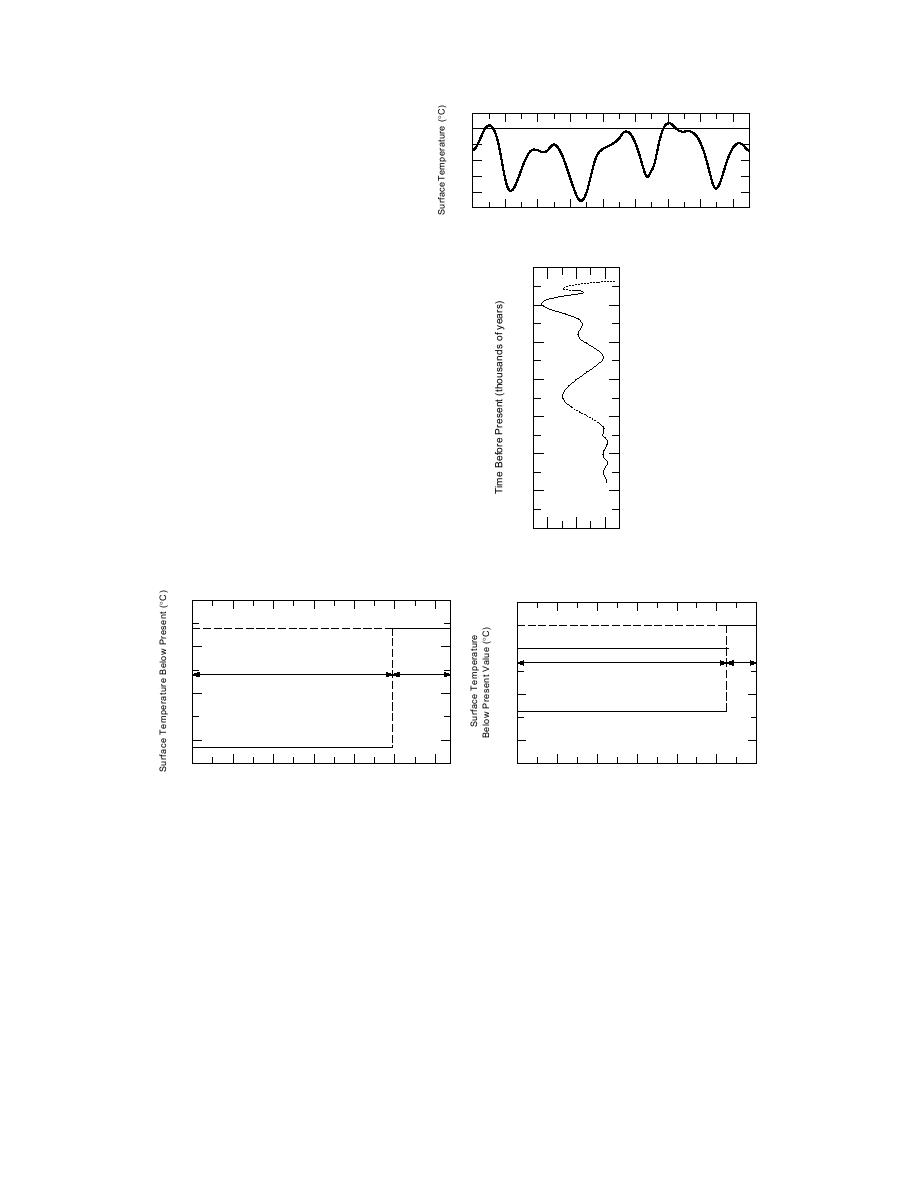
Figure 5. Permafrost surface paleotem-
6
perature model for East Siberian location
8
(after Maximova and Romanovsky 1988).
10
0
20
40
60
80
100
120
140
160
Time Before Present (thousands of years)
0
20
40
60
80
100
Figure 6. Reconstructed temperature
120
for northern China during last ice age
(after Sun and Li 1988).
140
12
8
4
Lower Than Present
Temperature (C)
0
2
1.0
1.2
Inter
2
0
Inter
Glacial
Glacial
Glacial
Glacial
4
2
2.76
6.3
6
4
0
20
40
60
80
100
120
0
20
40
60
80
100
120
Years Before Present (thousands of years)
Time Before Present (thousands of years)
a. Based on Vostok (Antarctica) ice core data,
b. Based on Brigham and Miller (1983) data,
∆T = 5.29C.
∆T = 2.54C.
Figure 7. Mean paleotemperature departure, Prudhoe Bay, Alaska, during one glacial cycle.
12C below the present values for varying periods of time. While extreme temperature drops at some sites
may have been significantly greater than these values, there is no convincing evidence of this. Temperature
variations of 8 to 12C during the last glaciation have also been reported from the Greenland ice cores
(Dansgaard and Oeschger 1989). Folland et al. (1990) note that global temperatures underwent 57C vari-
ations, with changes as great as 1015C at middle and high latitude regions of the Northern Hemisphere.
During the Eemian interglacial, temperatures in Siberia, Canada and Greenland may have increased by 4
8C. Thus, it would seem prudent to use extremal paleotemperature excursions on this order of magnitude
(1012C) for the development of permafrost formation models. We cannot ascribe the rapid growth of
deep permafrost to extraordinarily low temperatures that are beyond the ranges we have mentioned above.
Figure 7 shows two examples of average paleotemperatures for a glacial cycle made up of glacial and inter-
5


 Previous Page
