Mesozoic
Tertiary
Quaternary
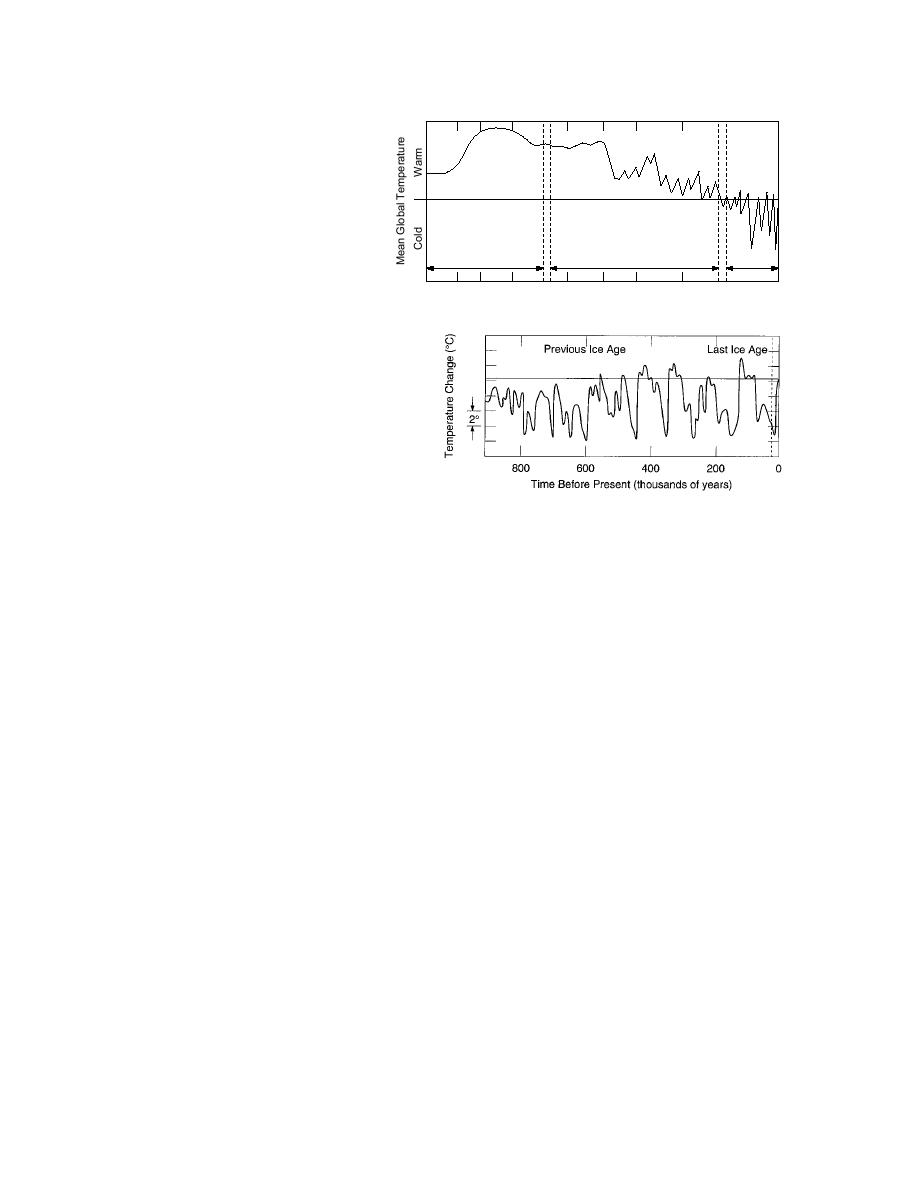
Figure 1. Paleotemperature varia-
180
150 135
100
65
58
38
25
13
1.8
0
tions (after Eddy and Bradley 1991).
Time Before Present (millions of years)
Figure 2. Pleistocene temperature fluc-
tuations (after Folland et al. 1990).
that began 35 million years before present. During the Pliocene, some 25 million years before present, the
temperature oscillated 04C above the present values. Permafrost was probably present at locations that
now have mean temperatures less than 14C but with greatly reduced thickness and quite variable temporal
existence.
The Quaternary Period, which includes the Pleistocene (about 1 million years) and the Holocene (present
to about 10,000 years), remains a time of greatly reduced temperatures and massive glaciations. The period
is marked by ice ages of 100,000 to 120,000 years duration, interrupted by interglacials, and with increas-
ingly severe minimum temperatures and temperature drops. We are now in the Holocene interglacial (which
is actually cooler than the previous interglacial, the Sangamon or Eem) and the record would seem to indi-
cate the next significant temperature move should be downward with a new ice age evolving. Figure 2
shows the temperature record (again from isotope analysis) for the past million years or so (Folland et al.
1990). We note graphically the record of at least four or five glacial periods, with the last one ending some
12,000 years ago in North America--the Wisconsin. The temperatures variations from present values swung
from highs of +3C during interglacials to lows of about 10C during the glacial maximums of the last mil-
lion years. The overall trends reveal very rapid temperature rises over time spans of approximately 12,000
13,000 years, followed by less rapid temperature drops over 20,000 years, followed by a period of about
100,000 years of gradually decreasing temperatures with interglacial temperature rises of 4C.
The temperature history of the past 160,000 years has been quantified using the deep glacial ice cores
taken in Greenland and Antarctica. Figure 3 shows the temperature variations from present values, for the
time of the last great ice age, taken from the isotope analysis of the Vostok (Antarctic) core (Jouzel et al.
1987). The maximum temperature excess of the past 160,000 years was about 3C and thus only the discon-
tinuous permafrost zones would have been in danger of disappearing, although there was continual change
in the permafrost thickness. If we assume that the temperature variations obtained from the ocean isotope
and ice core analyses are global, then the paleotemperature history at a specific site can be reconstructed us-
ing the present temperature data. This has been done for Prudhoe Bay by Osterkamp and Gosink (1991) as
shown in Figure 4 and for East Siberia by Maximova and Romanovsky (1988) (Fig. 5). Sun and Li (1988)
also presented a quantitative model of temperature fluctuations during the last ice age in northern China
(Fig. 6).
The isotopic data all indicate that the temperature at a given site could have dropped as much as 10 to
3


 Previous Page
