Table 7. Multiple axle analysis of resistance, tests 0126 and 0202.
Snow
Force (N)
Coefficient (R/V)
Test
depth
Density
(Mg/m3)
no.
(cm)
1*
2
3
4
1
2
3
4
0126e-l
12.2
0.11
----
----
54.3
46.7
----
----
0.0079
0.0088
0126e-r
11.2
0.11
----
----
93.0
3.1
----
----
0.0136
0.0006
0126f-l
14.2
0.11
----
----
74.7
60.5
----
----
0.0107
0.0110
0126f-r
12.8
0.11
----
----
104.1
36.9
----
----
0.0155
0.0070
0126g-l
13.6
0.11
167.7
85.0
----
----
0.0241
0.0163
----
----
0126g-r
12.7
0.11
182.8
79.6
----
----
0.0265
0.0145
----
----
Average
12.7
0.11
175.3
82.3
81.5
36.8
0.0253
0.0154
0.0094
0.0069
0202f-l
18.5
0.25
----
----
657.0
167.3
----
----
0.1002
0.0304
0202f-r
13.2
0.25
----
----
311.8
0.0
----
----
0.0415
0.0000
0202g-l
16.1
0.23
876.7
111.2
----
----
0.1271
0.0207
----
----
0202g-r
12.8
0.23
521.3
138.3
----
----
0.0724
0.0247
----
----
0202h-l
18.6
0.23
831.8
327.4
----
----
0.1187
0.0638
----
----
0202h-r
10.8
0.23
435.0
240.2
----
----
0.604
0.0411
----
----
Average
15
0.23
666.2
204.3
484.4
83.7
0.0955
0.0376
0.0709
0.0152
*Axle number.
where pmax is the maximum contact pressure of
Using the resistance data in Appendix C and a
the wheels in kilopascals. Figure 14 is a compari-
nonlinear regression analysis combined with the
son of the two prediction methods. Much better
assumptions that 1) the resistance of the first wheel
agreement is obtained using eq 1 and 7 as com-
through undisturbed snow is a function similar to
pared to eq 1 and the table of values for ρf.
eq 4 and 2) that the resistance of trailing tires can be
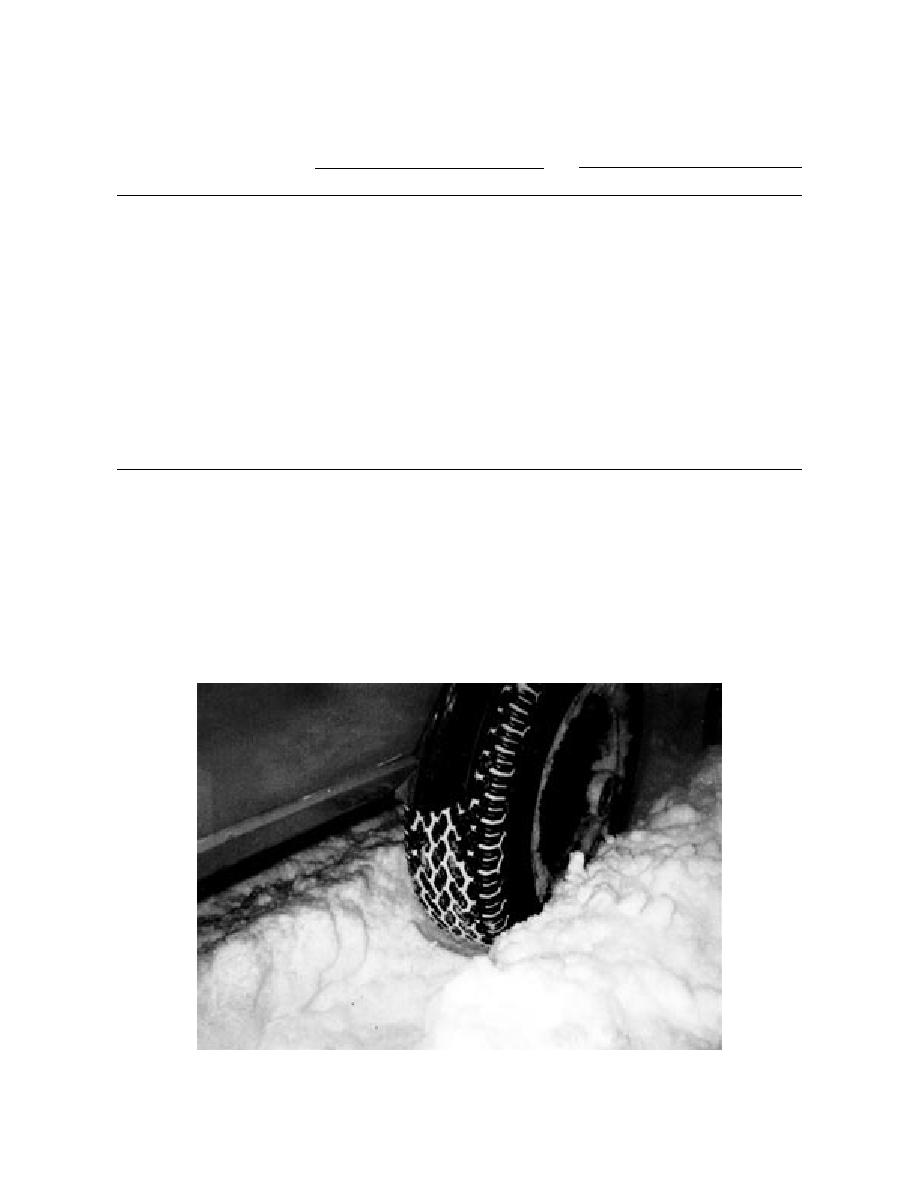
Figure 12. Loose snow in rut in front of trailing tire.
15


 Previous Page
