0.10
0.08
0.06
Test 0202
0.04
0.02
Test 0126
0
0
1
2
3
4
5
Number of Wheels through Snow
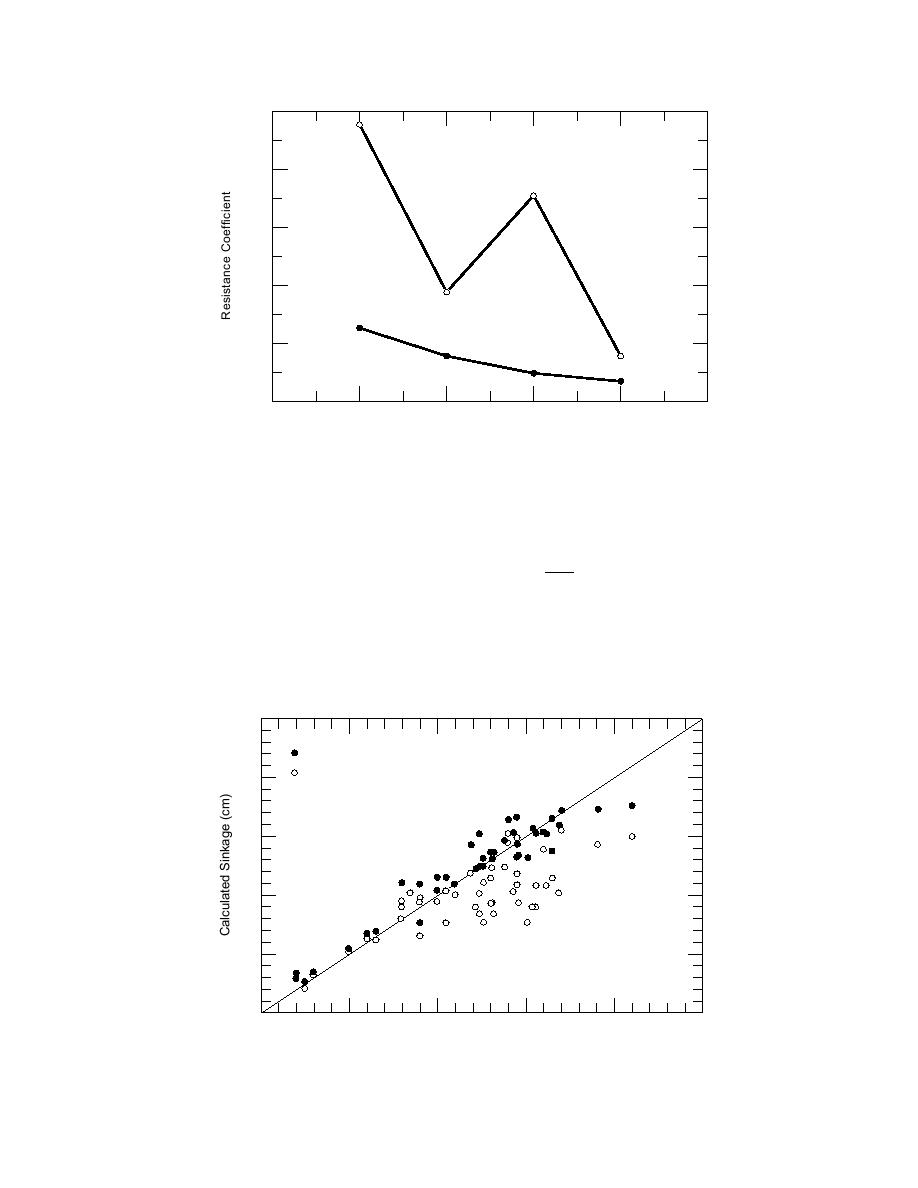
Figure 13. Plot of resistance coefficients for multiple passes.
represented as a coefficient multiplied by the ve-
where
hr = 1.0 if h ≤ 0.22 m
hicle wheel load, and 3) using the sinkage predic-
tion algorithm of eq 1 and 7, resulted in the follow-
h
hr =
ing equation for 1/2 the total vehicle resistance
if h > 0.22 m
0.22
(each axle is considered to be symmetrical).
where
(
)
1.26
Rs = 13.6041 ρo wa
+
h = snow depth (m)
(8)
L2 = 1/2 the load (N) on the second axle
0.0475 hr L2 + 0.0246 hr L3
L3 = 1/2 the load (N) on the third axle.
25
Eq 1 and 7
Eq 1 with Table
20
of Values for ρf
15
10
Over-predicted
5
Under-predicted
0
0
5
10
15
20
25
Measured Sinkage (cm)
Figure 14. Comparison of two sinkage prediction algorithms.
16


 Previous Page
