50 10 3
40
30
20
10
0
10
1
2
3
4
7
9
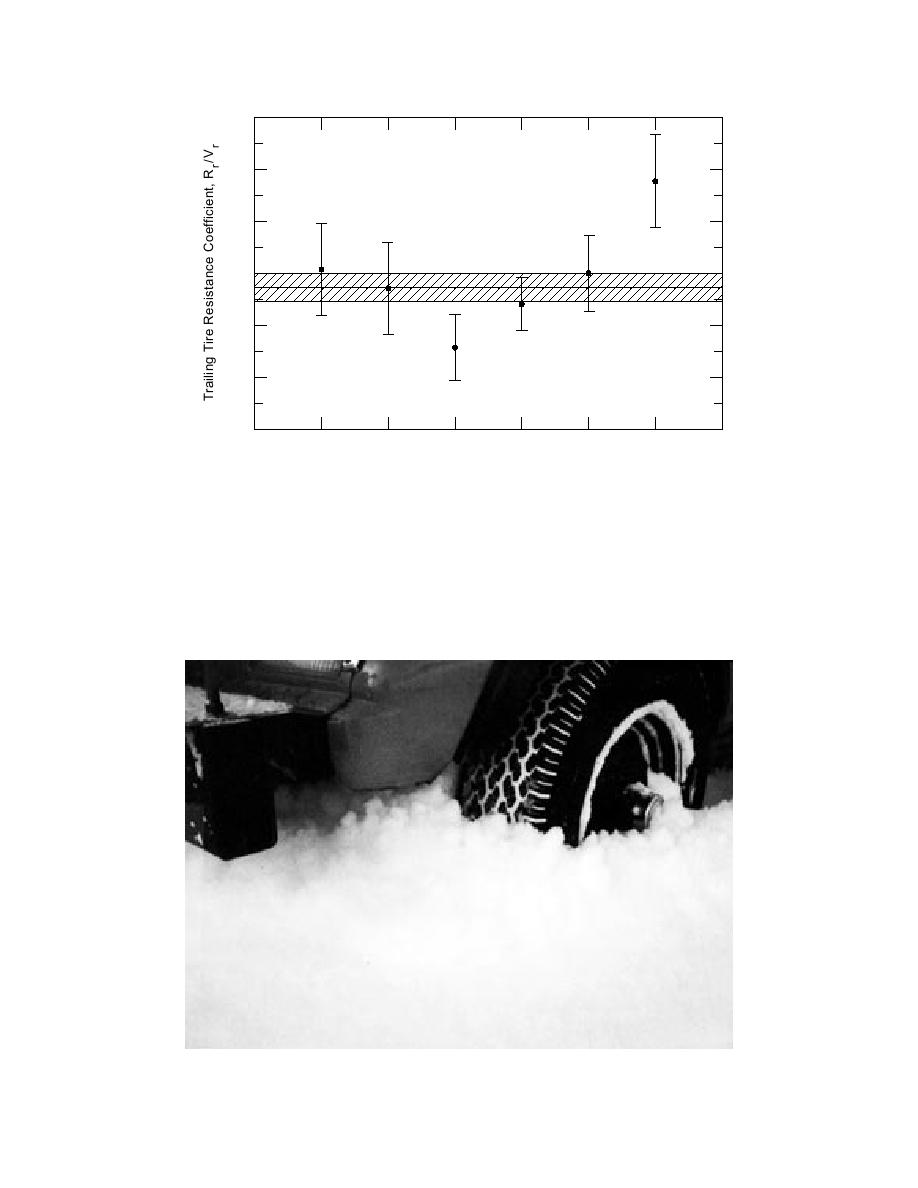
Data Set Number
Figure 6. Ninety-five percent confidence intervals for the means. Shaded area is the mean
and 95% confidence interval for combined sets 1, 2, 4 and 7.
Figure 7. Snow in front of wheel.
10


 Previous Page
