10
Velocity
Test 0125h
8
6
4
2
Force due to Gravity
0
Sum of Load Cell Forces
2
0
2
4
6
Time (s)
a. Test 0125h.
8
Test 0125i
6
Velocity
4
2
Force due to Gravity
0
Sum of Load Cell Forces
2
0
2
4
6
8
10
Time (s)
b. Test 0125i.
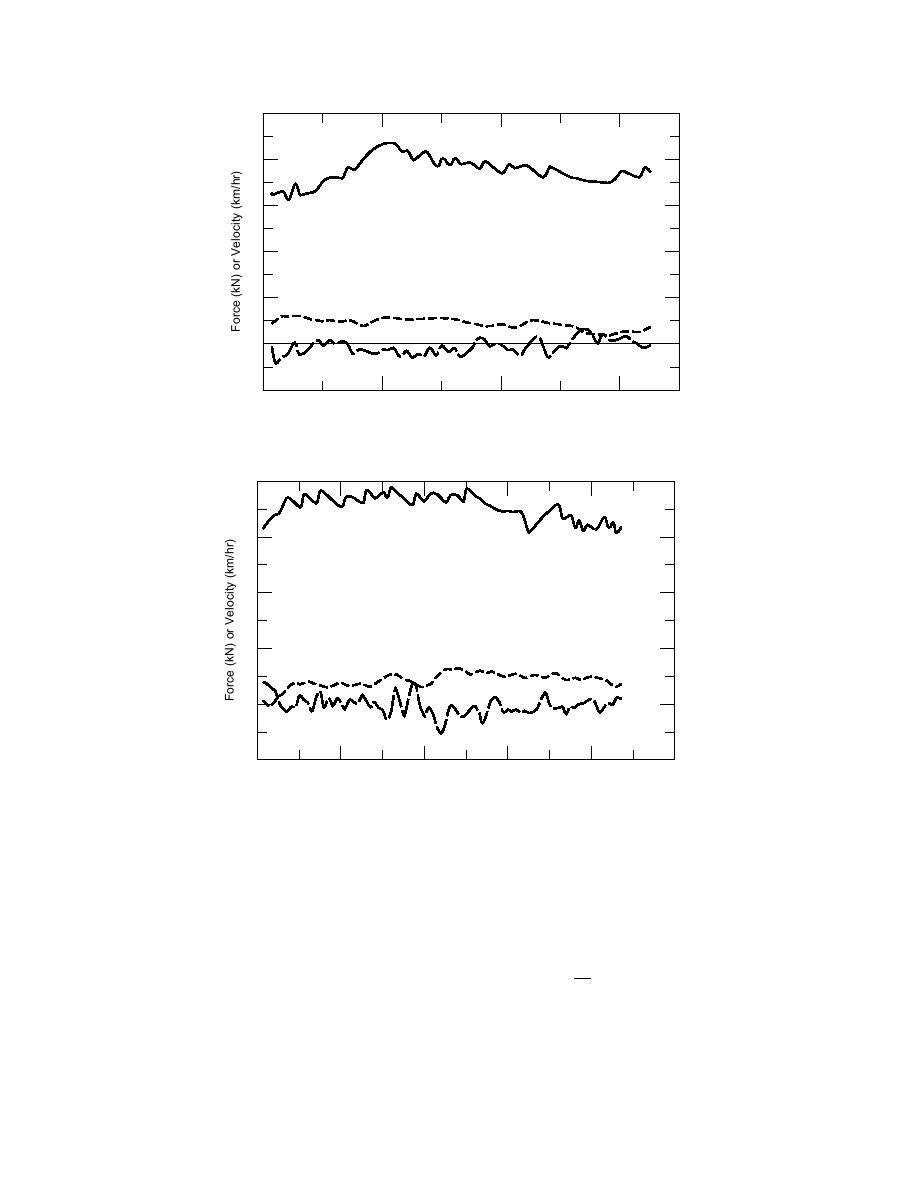
Figure 11. Net force and velocity vs. time.
final density (ρf). The sinkage prediction algo-
tains the data presented by Blaisdell et al. (1990),
Richmond et al. (1990), and Green and Blaisdell
rithm for undisturbed snow remains as (eq 1)
(1991), combined with the data presented herein.
The data are presented in the form in which they
ρ
z = h 1 0
were used to develop the following algorithms.
ρf
The first step was to reevaluate the sinkage
relationship of Richmond et al. (1990). It was found
that, if the tracked vehicle data were ignored, a
and the final density is now calculated using
linear trend exists between the highest contact
ρf = 0.519 + 0.0023 pmax
pressure of a preceding wheel and the theoretical
(7)
14


 Previous Page
