8
2000
Bread Truck Drainage
1600
7
6
Salinity
1200
OBS
6
5
Elevation
800
5
4
400
4
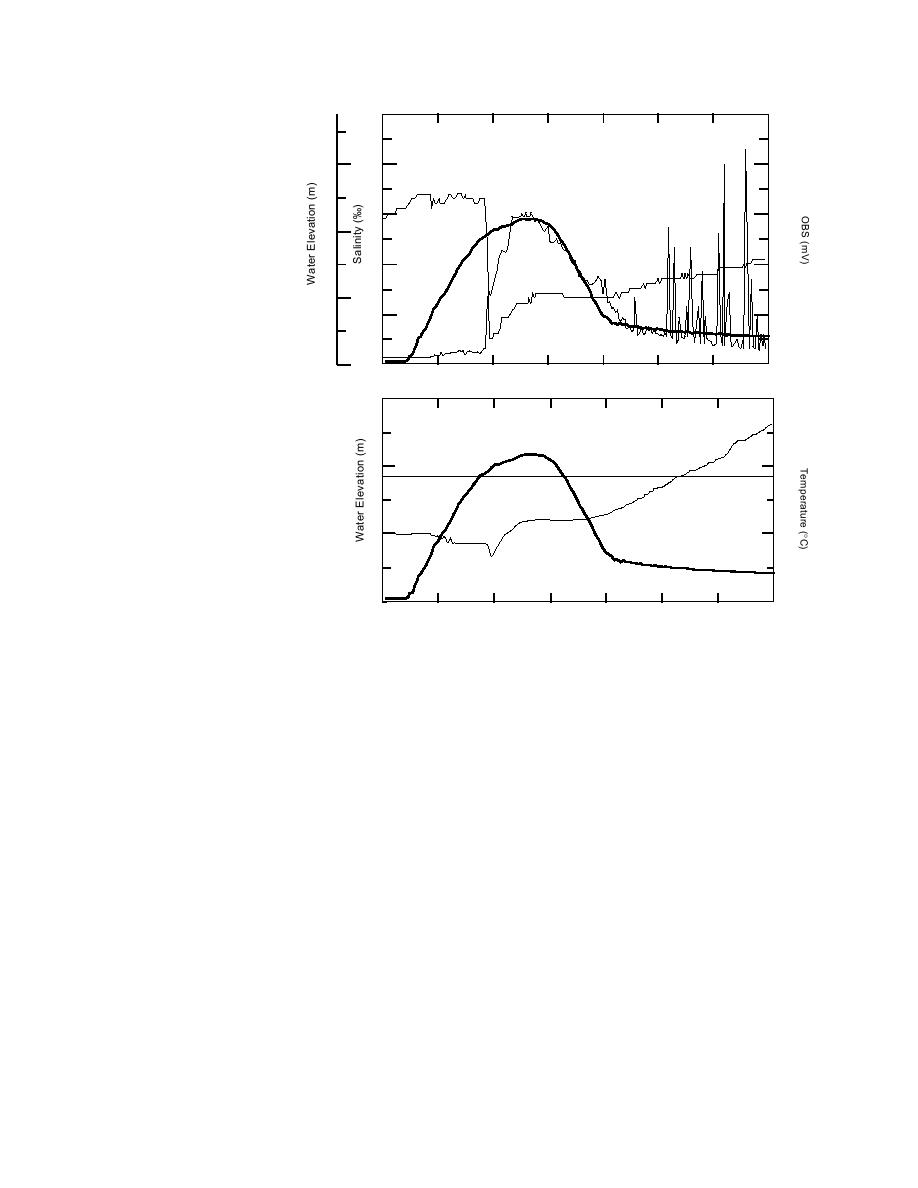
a. Water elevation, salinity
and optical backscatter meas-
urement.
0
3
3
06:00
07:00
08:00
09:00
10:00
11:00
12:00
13:00
6
16
Bread Truck Drainage
5
14
Depth to flooding
Elevation
4
12
Temperature
b. Water elevation, temperature
and depth to flooding of the
mudflats.
3
10
06:00
07:00
08:00
09:00
10:00
11:00
12:00
13:00
Figure 19. Variation of water quality parameters, Bread Truck drainage site, 18 August.
dominated waters therefore takes place more
the flood tide progresses into ERF, it moves up
gradually. In part, the more gradual change in
the Eagle River, backing river waters up each
temperature and salinity, for example, results
gully, and causing them to spill onto the mud-
from mixing and homogenization in the ponds
flats. The water level rises initially at a steady
and mudflats.
rate, but rapidly decreases as the area being
The sharp, transient rises in turbidity are,
flooded increases when the water crests the gul-
however, related to some other process. They
ly headwall and spills into the vegetated drain-
may be caused by vegetation or fish covering
ageway and onto the mudflats above it. Water
the optic sensor, but are most likely actual in-
temperature, salinity and turbidity change in the
creases in turbidity from sediment in transport.
headwater pool in which the sensors are sub-
The increased turbidity may be caused by scour
merged as its water is exchanged with the more
of the gully headwall or lateral walls, or perhaps
saline tidal flood waters. Just before the headwa-
sudden bank failures, causing a rapid, but local,
ter pool attains conditions that reflect the charac-
increase in the amount of sediment suspended
ter of Knik Arm waters, parameters may fluctu-
in the water column. Until ebb waters are com-
ate rapidly while the mixing front of the two
pletely contained in the gully channel during the
water masses passes.
latter stages of runoff, water may flow into the
During ebb, the drop in water level is slower
gullies at numerous locations along their
than the rise during flooding, indicating tem-
lengths.
porary storage of tidal waters within the Flats.
Data from the heads of the Bread Truck and
The stored water may include river influx and
Parachute drainages during a flood and ebb
possibly may involve temporary storage in the
cycle on 2021 August of a predicted high tide of
sediments as groundwater. The transition from
10.0 m and on 1819 September of a predicted
more saline tidal flood waters to fresh or pond-
20


 Previous Page
