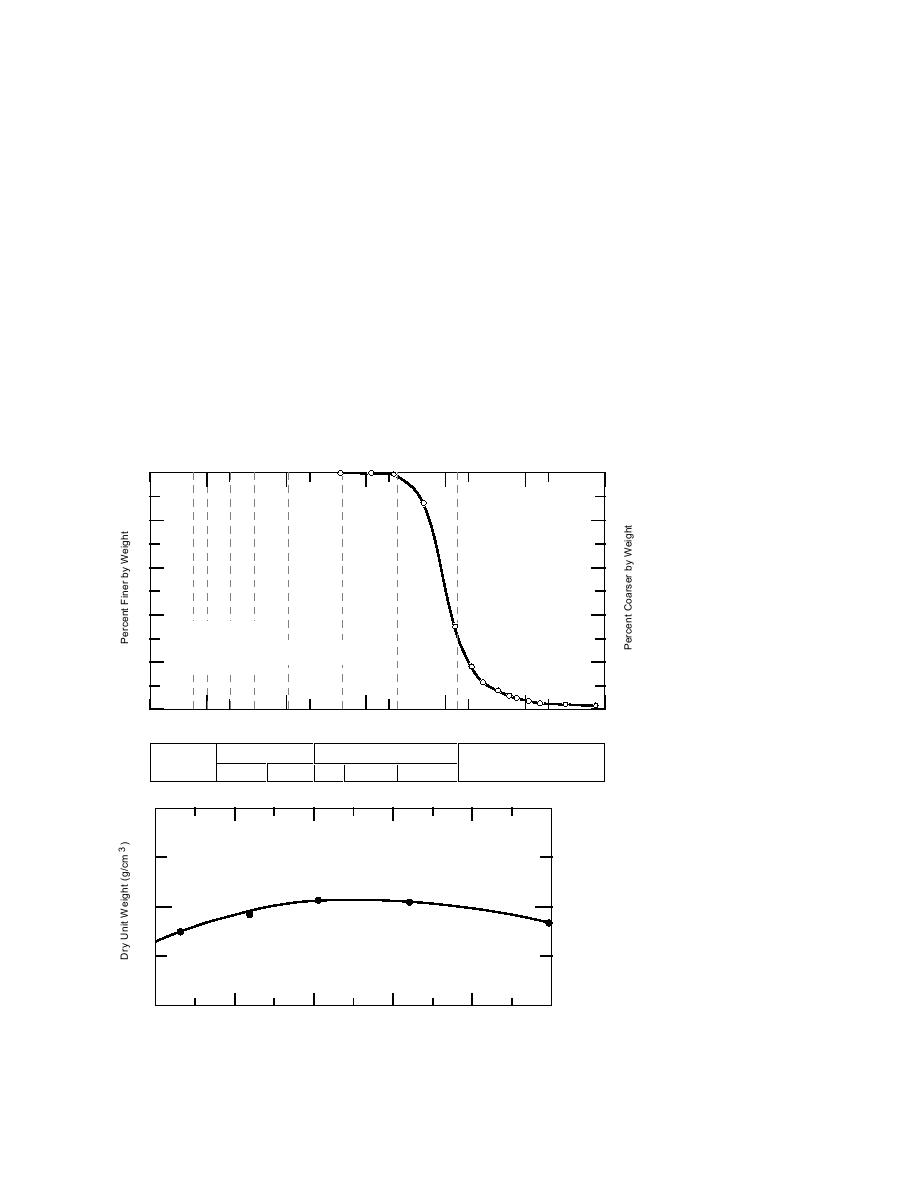
ing conditions are encountered in clays and me-
Because these relationships were derived from
dium- or high-plasticity soils, we recommend that
tests on a non-plastic fine sand (unified soil clas-
algorithms designed to treat surface slipperiness
sification SM) (Fig. 16), and limited tests on other
(Willoughby et al. 1991) be implemented in fu-
sandy soils indicate the same general trends, we
ture versions of NRMM/CAMMS. Continuing
feel confident applying them to the following soil
research is aimed at completing the definition of
types:
f and g for more soil types and wetness conditions.
SW: Well-graded sands, gravely sands, little
or no fines
SP: Poorly graded sands, gravely sands, little
or no fines
SPEED MADE GOOD
SM: Silty sands, sand and silt mixtures.
It is also reasonable to extrapolate beyond the range
The time to get from one point to another, or
of test soils to other soils of similar mechanical
speed made good, is a function of many vehicle/
operator and terrain/environment variables. Some
behavior, such as other sands (SC), gravels (GW,
GP, GM, GC) and silts (ML). We don't advise that
reduction in speed occurs as a wheel or track slips.
they be applied to clayey soils or highly plastic
Making the assumptions that
For a vehicle moving at a constant velocity
soils since the behavior of the soil, and there-
on level terrain the traction generated must
fore its influence on traction and motion resis-
equal the total motion resistance,
tance, is likely to be quite different. When thaw-
Hydrometer
U.S. Standard Sieve Numbers
6" 4"
2"
1"
10
40
200
3/8"
100
0
20
80
60
40
40
60
Lebanon Sand (SM)
Liquid Limit: 20
Specific Retention Water Content: 12 - 14%
20
80
Specific Gravity: 2.71
100
0
100
10
1
0.1
0.01
0.001
Grain Size (mm)
Gravel
Sand
Cobbles
Silt or Clay
Coarse
Fine
C'rse
Medium
Fine
a. Grain size distribution.
2.0
CE-55
Modified Proctor
1.8
b. Soil compaction curve.
Figure 16. Characteristics of
1.6
8
10
12
14
16
18
Lebanon sand.
Water Content (%)
14


 Previous Page
