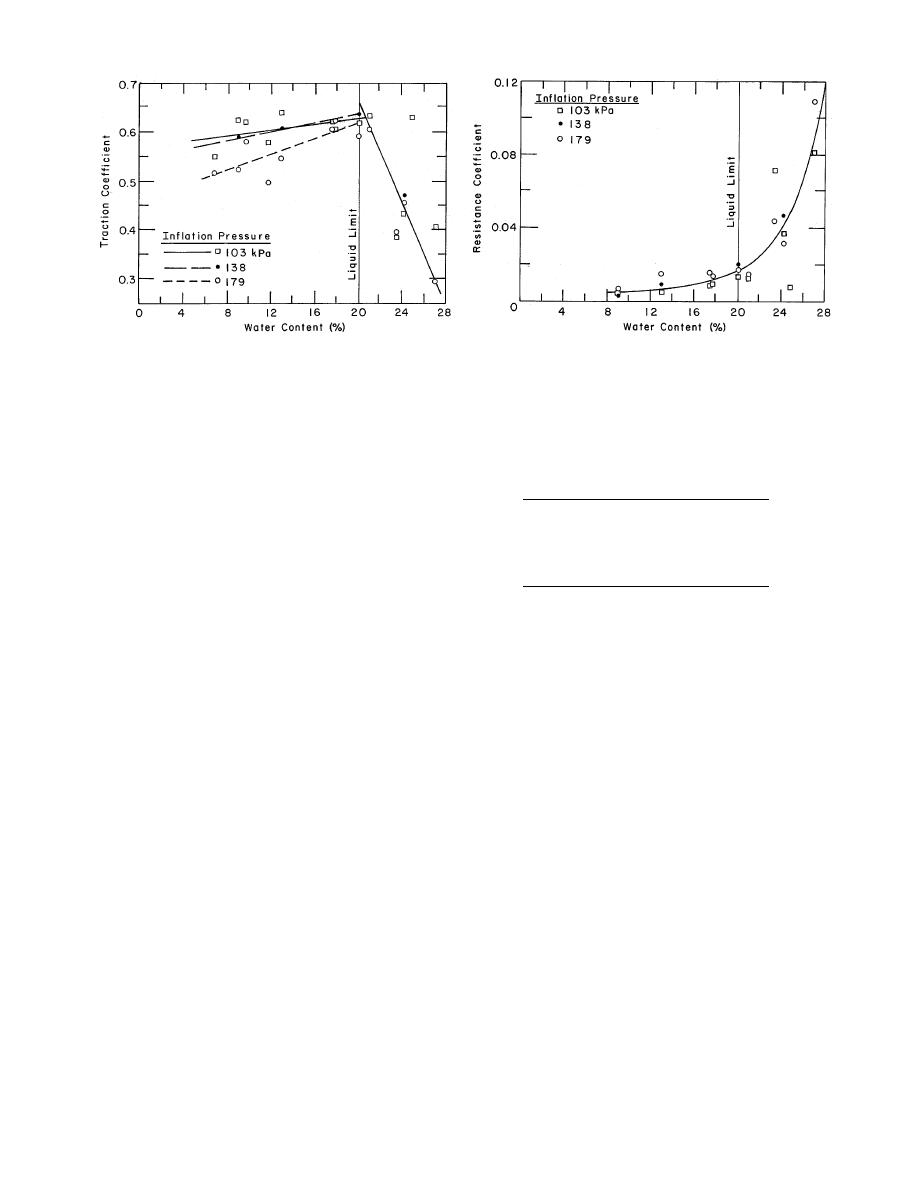
Figure 14. Traction coefficient and resistance coefficient vs. water content. Below the liquid limit, traction is a function of
applied stress as reflected in tire inflation pressure. The net tractive coefficient decreases and the motion resistance coefficient
increases for soil water contents above the liquid limit.
Tgross = gross traction for the unfrozen soil
Table 2. Soil wetness descriptions.
Rterrain = terrain resistance for the unfrozen
Water content
Saturation
soil.
Soil wetness
(%)
(%)
The multipliers are defined based on the mea-
wet*
2327
83100
surements of vehicle performance on thawing soil
reported in Shoop (1990, 1993c). The experiments
moist
1721
7782
were performed using an instrumented vehicle to
dry†
613
2359
measure traction and motion resistance on a wide
variety of thawing conditions for a fine-grained
* Nearly saturated and above the liquid limit.
sand. The experimental variables were soil thaw
† Below the specific retention of the soil.
depth, moisture content, density and applied stress
(tire inflation pressure).
The multipliers f and g vary with soil type,
wetness, contact stress and thaw depth. Traction
layer is strong enough that traction and motion
and motion resistance vary with the wetness of
resistance are nearly constant for all thaw depths
the thawed soil layer as shown in Figure 14. At
S. For "dry" soils the thawing has a small effect
lower water contents the traction coefficient de-
on the overall soil strength, and traction is a func-
pends on the tire contact stress. At high soil mois-
tion of both thaw depth and applied stress. Since
ture (above the liquid limit), traction drops rap-
this function has not yet been defined, we cur-
idly, and the contact stress has no noticeable ef-
rently use an interim value of 1. For "dry" soils
fect. Motion resistance increases considerably at
the effect of thawing on motion resistance is neg-
soil moistures above the liquid limit, and the ef-
ligible.
fect of tire inflation pressure was negligible for
The following expressions define the multipli-
the conditions tested.
ers f and g in eq 16 and 17:
The effect of the depth of thaw can be seen
clearly when the data are grouped according to
Traction:
the wetness of the thawed layer (Fig. 15). The de-
Wet soils
gree of wetness in the thawed layer is defined in
S ≤ 2.5 cm (18)
Table 2. For both traction and motion resistance,
f = 1.0
the "wet" conditions are the most critical. When
the soil is "moist," the soil strength is near opti-
f = 2.379 (1/S2) + 0.619
2.5 < S < 15 (19)
mum, and much of its strength is retained during
the thaw cycle. Thus, for moist soils the thawing
15 ≤ S
f = 0.63
(20)
12


 Previous Page
