0.7
0.6
0.5
Water Content
0.4
1
6-13% (dry)
27-21% (moist)
3-27% (wet)
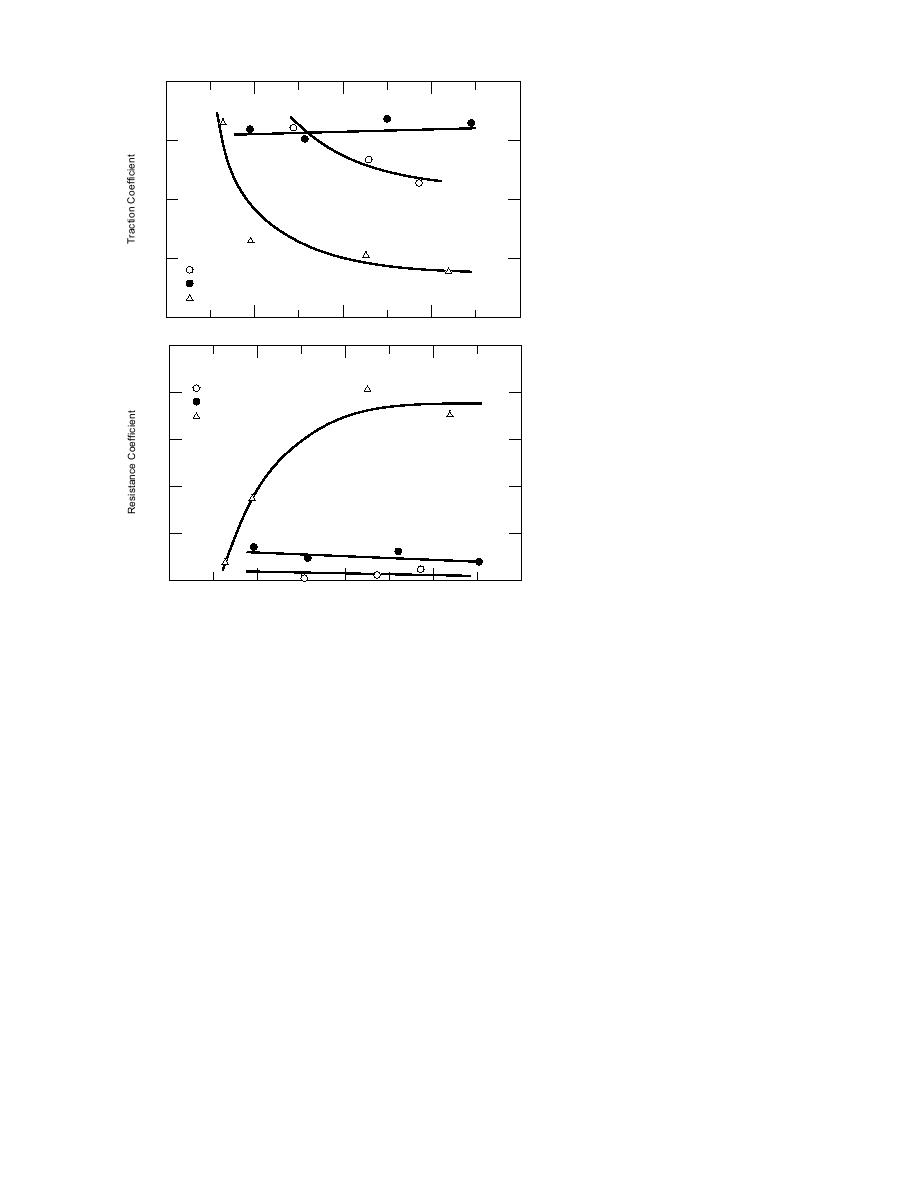
a. Traction coefficient vs. thaw depth.
0.3
0
4
8
12
16
0.10
Water Content
1
6-13% (dry)
0.08
27-21% (moist)
3-27% (wet)
0.06
0.04
0.02
0
0
4
8
12
16
b. Resistance coefficient vs. thaw depth.
Thaw Depth (cm)
Figure 15. Effect of soil thaw depth on net traction and motion resistance coefficients as a function of soil
moisture content.
These equations are based on data obtained us-
ing an instrumented Jeep Cherokee (gross vehicle
Moist soils
weight of 5600 lb.) equipped with light-truck, all-
f = 1.0
(21)
season, radial tires at a variety of tire inflation pres-
Dry soils
sures (Shoop et al. 1993). For very heavy vehicles
f = 1.0.
(22)
and for tracked vehicles, the critical thaw depth
will change because of the larger and deeper vol-
Motion resistance:
ume affected by the applied stress. Because of the
Wet soils
lack of effect of tire inflation pressure (contact pres-
S ≤ 2.5 cm (23)
g = 1.0
sure) for the most critical conditions (wet), the pro-
posed relationships can be applied to a wide vari-
g = 2.883 S 6.056
2.5 < S < 4 (24)
ety of vehicles with the understanding that there
are no experimental data to validate the results.
g = 0.22 S2 + 3.54 S 5.24 4 ≤ S ≤ 8 (25)
This aspect will be addressed in future studies.
The traction relationships are based on the op-
8 < S < 12 (26)
g = 0.225 S + 7.2167
timum available traction, obtained by taking an
12 ≤ S (27)
average of the top 20% of the traction curve. The
g = 10.00
relative slip values and traction curve shapes were
Moist or dry soils
not evaluated.
g = 1.0.
(28)
13


 Previous Page
