EM 1110-2-2907
1 October 2003
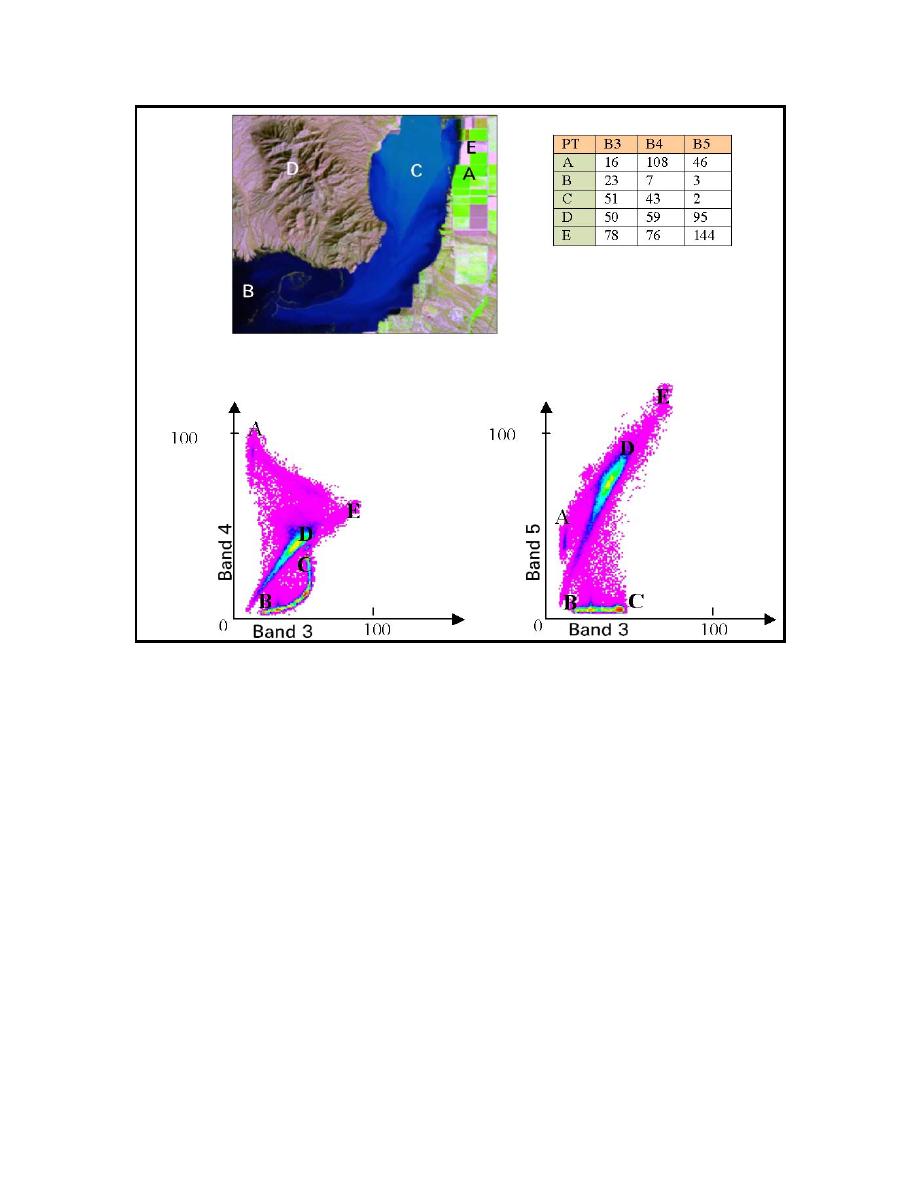
Figure 5-8. Landsat TM band 345 RGB color composite with accompanying image scatter
plots. The scatter plots map band 3 relative to bands 4 and 5 onto a feature space graph.
The data points in the plot are color coded to display pixel population. The table provides
the pixel count for five image features in band 3, 4, and 5. A is agricultural land, B is deep
(partially clear) water, C is sediment laden water, D is undeveloped land, E fallow fields.
Image developed for Prospect (2002 and 2003).
(2) Enhancing Pixel Digital Number Values. Images can enhance or stretch the
visual display of an image by setting up a different relationship between the DN and the
brightness level. The enhancement relationship created will depend on the distribution of
pixel DN values and which features need enhancement. The enhancement can be applied
to both gray- and color-scale images.
(3) Contrast Enhancement Techniques. The histogram chart and lookup table are
useful tools in image enhancement. Enhancement stretching involves a variety of tech-
niques, including contrast stretching, histogram equalization, logarithmic enhancement,
and manual enhancement. These methods assume the image has a full range of intensity
(from 0255 in 8-bit data) to display the maximum contrast.
(4) Linear Contrast Stretching. Contrast stretching takes an image with clustered
intensity values and stretches its values linearly over the 0255 range. Pixels in a very
5-16


 Previous Page
