EM 1110-2-2907
1 October 2003
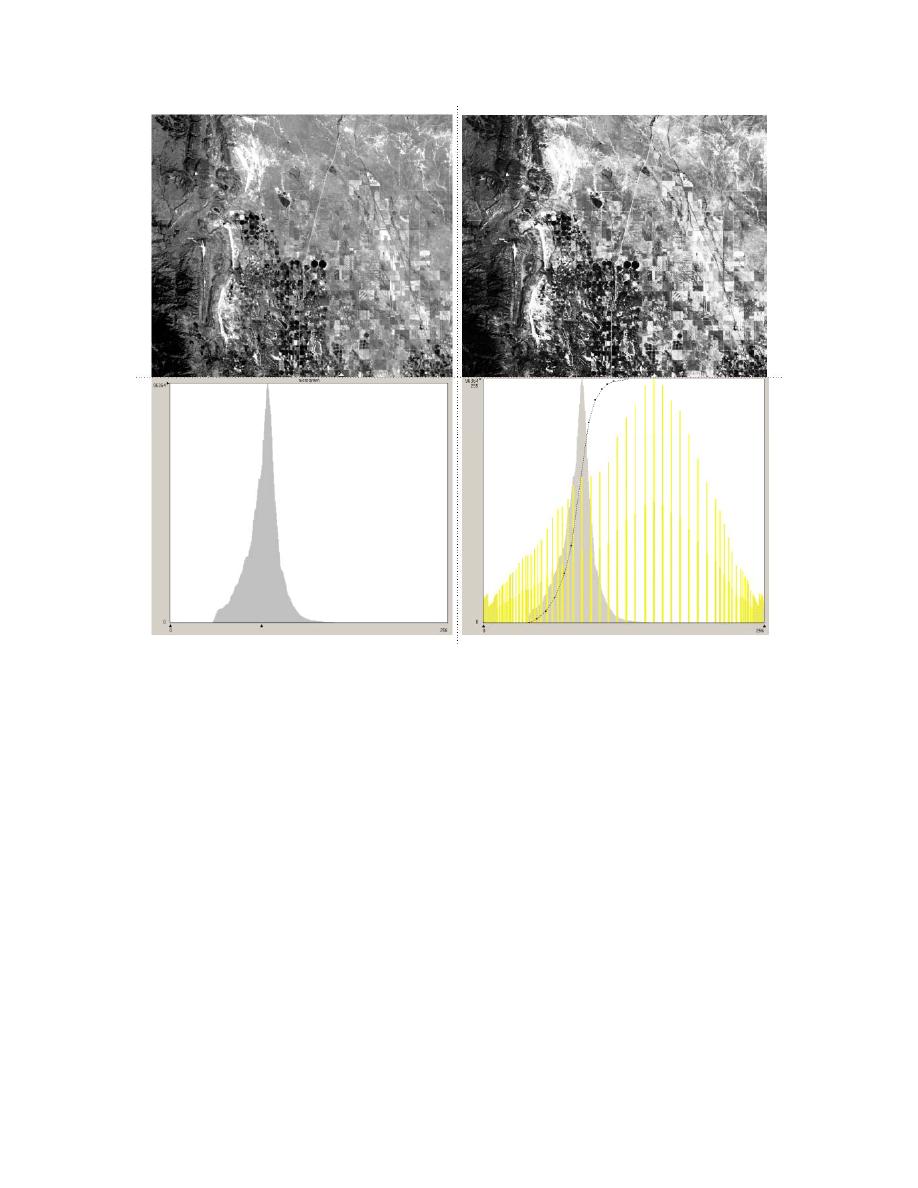
b. After histogram equalization stretch the
a. Image and its corresponding DN
pixels are reassigned new values and
histogram show that the majority of
spread out across the entire value range.
pixels are clustered together (cen-
The data maximum is subdued while the
tering approximately on DN value
histogram leading and trailing edges are
of 100).
amplified, the resulting image has an
overall increase in contrast.
Figure 5-10. Landsat image of Denver area.
5-19


 Previous Page
