EM 1110-2-2907
1 October 2003
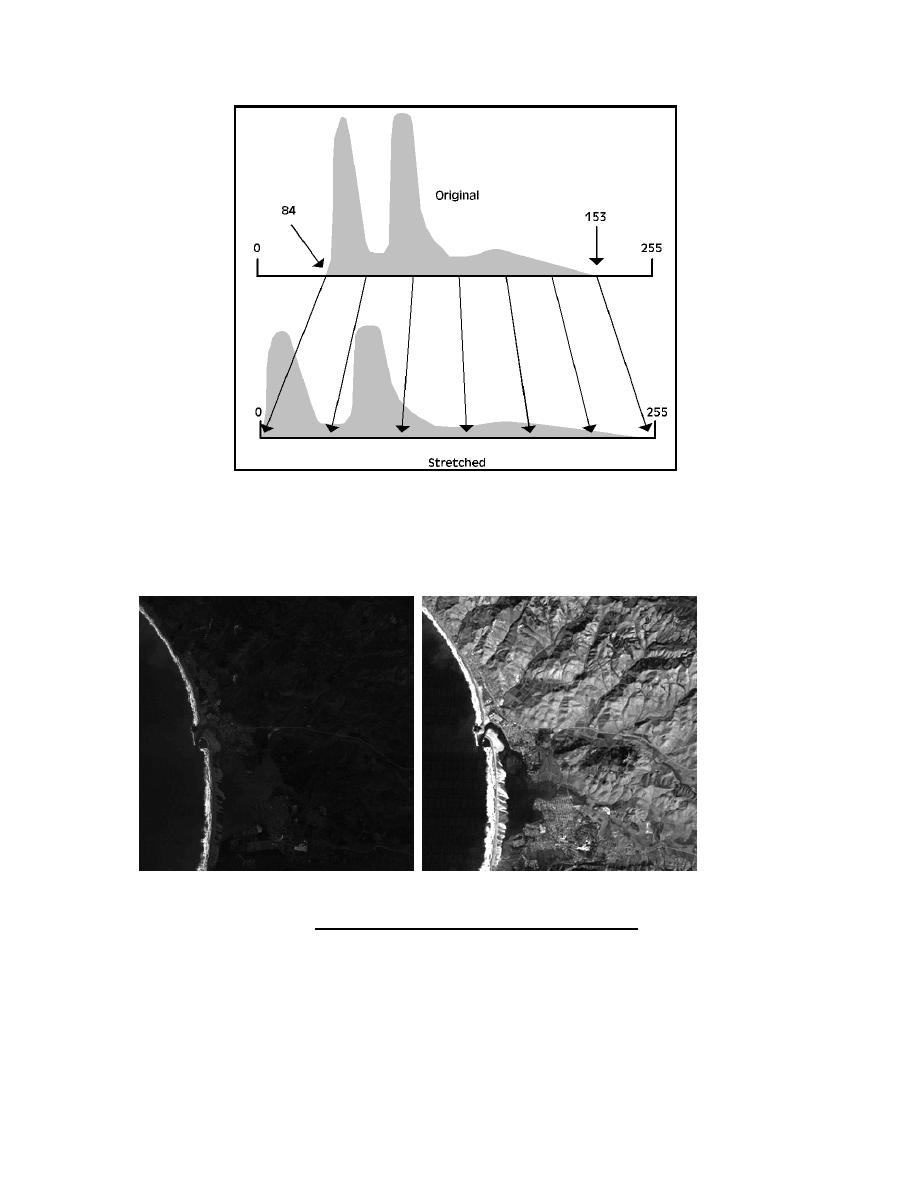
Figure 5-5. A linear stretch involves identifying the minimum
and maximum brightness values in the image histogram and
applying a transformation to stretch this range to fill the full
range across 0 to 255.
Figure 5-6. Contrast in an image before (left) and after (right) a linear con-
trast stretch. Taken from http://rst.gsfc.nasa.gov/Sect1/Sect1_12a.html.
(b) The raw data can be reassigned in a number of ways to improve the contrast
needed to visually interpret the data. The technique of reassigning the pixel DN value is
known as the image enhancement process. Image enhancement adds contrast to the data
by stretching clustered DNs across the 0255 range. If only a small part of the DN range
is of interest, image enhancement can stretch those values and compress the end values
to suppress their contrast. If a number of DNs are clustered on the 255 end of the range,
5-13


 Previous Page
