Freezing Rate, mm/hr
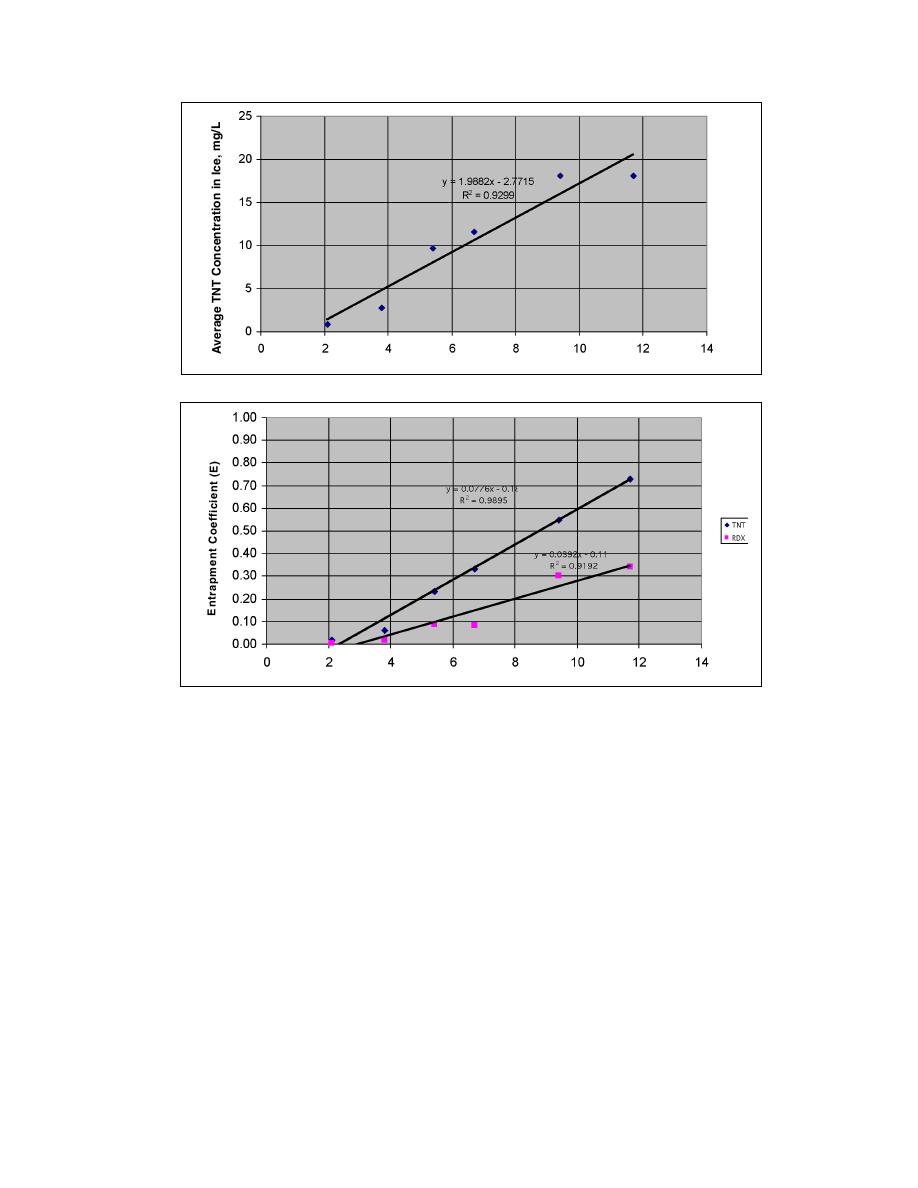
Figure 6. Effect of freezing rate on average TNT concentration in ice column.
Freezing Rate, mm/hr
Figure 7. Entrapment coefficients for TNT and RDX as a function of freezing. rate.
to that observed for TNT. In this case, the pinkwater
concentration can remove water (in the form of ice)
contained only 12.0 mg/L RDX, which is below the
from pinkwater. The quality of the meltwater depends
current MCAAP discharge limit of 15.0 mg/L. There-
on the freezing rate, as indicated earlier in Figures 4
fore the main treatment concern is TNT.
and 5, and directly shown in Figure 6. According to
TNT and RDX concentrations in the residuals gen-
the linear line of best fit, a freezing rate of 1.9 mm/hr
erally increased as the freezing rate decreased (see Table
would be required to produce a meltwater with an
2). This is consistent with the previous ice cylinder
average TNT concentration of 1.0 mg/L, which is the
measurements, which showed that more TNT and RDX
discharge limit for McAlester AAP. The estimated frac-
were being rejected at the lower freezing rates. There
tion of 1.0 mg/L TNT meltwater produced by freeze
was a concern that freeze concentration would cause
concentration at a 1.9 mm/hr freezing rate is 0.67. This
TNT and RDX to precipitate out and thus become an
estimate is based on the data shown in Figure 4 where
explosion hazard. However, that never happened be-
average TNT concentrations in the ice cylinder remain
cause none of the residuals approached TNT or RDX
near 1.0 mg/L for 20 cm, which is 67% of the pinkwater
saturation. According to Leggett (1985), the solubility
sample.
limits for TNT and RDX are 130 and 42 mg/L, respec-
A freezing rate of 1.9 mm/hr is much too slow for
tively.
industrial ice-making equipment such as the ice maker
shown in Figure 1. This equipment can freeze water at
DISCUSSION
a rate of almost 270 mm/hr. It may be possible to slow
the rate of freezing but the output would be drastically
The results of these experiments show that freeze
reduced.
6


 Previous Page
