ing rates of 3.8 and 2.1 mm/hr. The pattern is consis-
high concentration in the first segment can be explained
tent with the mechanism of the freeze concentration
by the fact that the freezing rate was probably faster
process discussed earlier.
near the aluminum end cap, which has a greater heat
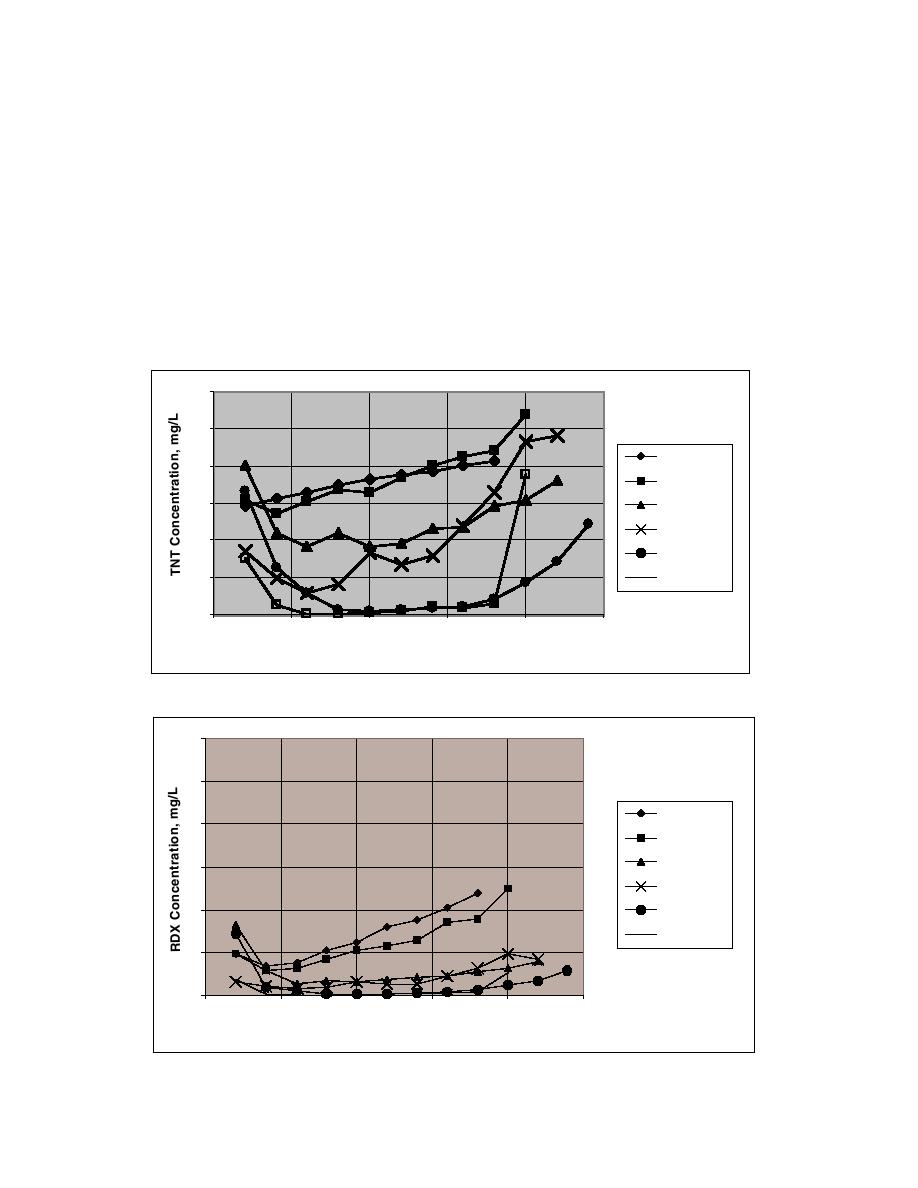
The plots in Figure 4 show that the TNT concentra-
transfer capacity than ice. From 2 cm to 16 cm, TNT
tion in the ice cylinders varied according to freezing
inclusion was relatively constant, although the concen-
distance. For example, at the 6.7 mm/hr freezing rate,
tration of TNT in the residuals was increasing. Beyond
the average TNT concentration in the first 2 cm of ice
16 cm, the TNT concentration in the residual ahead of
was 20.22 mg/L. In the second 2 cm of ice (freezing
the freezing front was too great to continue the rejec-
distance = 4 cm), the TNT concentration dropped to
tion rate, and so more TNT was included in the ice
11.01 mg/L. From this point to a freezing distance of
cylinder. The higher concentration in the end segment
16 cm, the TNT concentration varied only slightly from
was probably caused by the inclusion of rejected con-
9.20 mg/L to 11.86 mg/L. At 18 cm, the TNT concen-
taminants attached to the end of the segment.
tration jumped up to 14.76 mg/L and continued to climb
The effect of freeze concentration on RDX is shown
to 15.52 mg/L at 20 cm, and 18.03 mg/L at 22 cm. The
in Figure 5. The freeze concentration effect is similar
30
25
11.7 mm/hr
11.7 mm/h
20
9.4 mm/hr
9.4 mm/hr
6.7 mm/hr
6.7 mm/hr
15
5.4 mm/hr
5 .4 mm/hr
3 8 mm/hr
10
2.1 mm/hr
3.8 mm/hr
2.1 mm/hr
5
0
0
5
10
15
20
25
Freezing Distance
Figure 4. TNT concentration in ice cylinder at each freezing rate.
30
25
11.7.mm/hr
11 7 mm/hr
20
9.4.mm/hr
9 4 mm/hr
6.7.mm/hr
6 7 mm/hr
15
5.4.mm/hr
5 4 mm/hr
3.8.mm/hr
3 8 mm/hr
10
2.1.mm/hr
2 1 mm/hr
5
0
0
5
10
15
20
25
Freezing Distance, cm
Figure 5. RDX concentration in ice cylinder at each freezing rate.
5


 Previous Page
