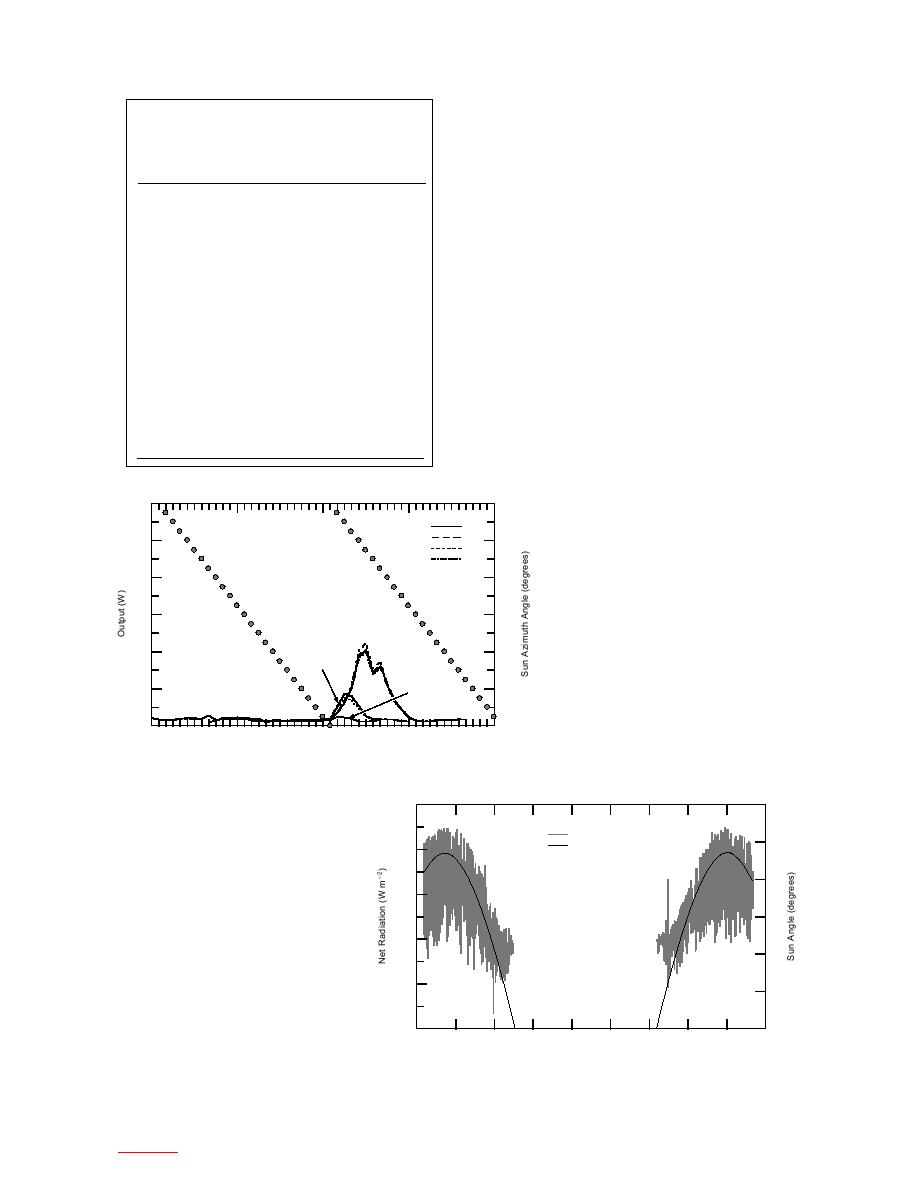
Net radiometer readings
Table 6. Low-visibility day PV panel performance.
To get an understanding of the amount of potential
power available for the PV panels, the net radiation
ARO
Measured
Related
values were measured. The intensity of the available
mounting
PV
output
output
potential power depends on the sun declination angle
location
panel
power (W)
power (W)
and visibility. At the highest sun declination angle, net
South Side
1A
2.0
51.0
1B
2.1
47.2
the horizontal position. Figure 13 shows the net radia-
1C
2.0
50.0
1D
2.1
50.0
tion values during the austral summers.
East Side
2A
1.5
51.0
SITREP98 data
2B
1.5
47.2
2C
1.5
50.0
The source of the SITREP98 data was the South Pole
2D
1.5
50.0
weekly climatological summary, which provides unin-
North Side
3A
1.8
51.0
terrupted temperature and wind speed data from 22
3B
1.8
47.2
November 1997 to 12 December 1998. Figure 14 depicts
3C
1.8
50.0
the extreme temperatures to which the PV panels were
3D
1.6
50.0
exposed. Temperatures ranged from approximately
20 to 70C.
West Side
4A
20.4
51.0
4B
21.0
47.2
Figure 15 shows the average wind speed and gusts
4C
22.3
50.0
that the PV panels had to endure. The PV panels were
4D
20.0
50.0
exposed to a constant wind speed of approximately 5
m/s, with gusts up to 20 m/s.
60
360
Azimuth
A
B
50
300
C
D
40
240
30
180
West Side
20
120
North Side
Panel 4
Panel 3
East Side
10
60
Panel 2
South Side
Panel 1
0
0
14 Nov 1998
15 Nov 1998
13 Nov 1998
Noon
Noon
Midnight
Midnight
Midnight
Figure 12. PV panel performance on the low-visibility day (13 to 14 January
1998) over 24 hours.
30
300
Net Radiation
25
Sun Angle
200
20
100
15
0
10
100
5
0
200
16 Nov
5 Jan
24 Feb 15 Apr
4 Jun
24 Jul
12 Sep
1 Nov
21 Dec
9 Feb
1997
1998
1998
1998
1998
1998
1998
1998
1998
1999
Figure 13. Net radiometer readings from 25 November 1997 to 23 January
1999.
9
to contents


 Previous Page
