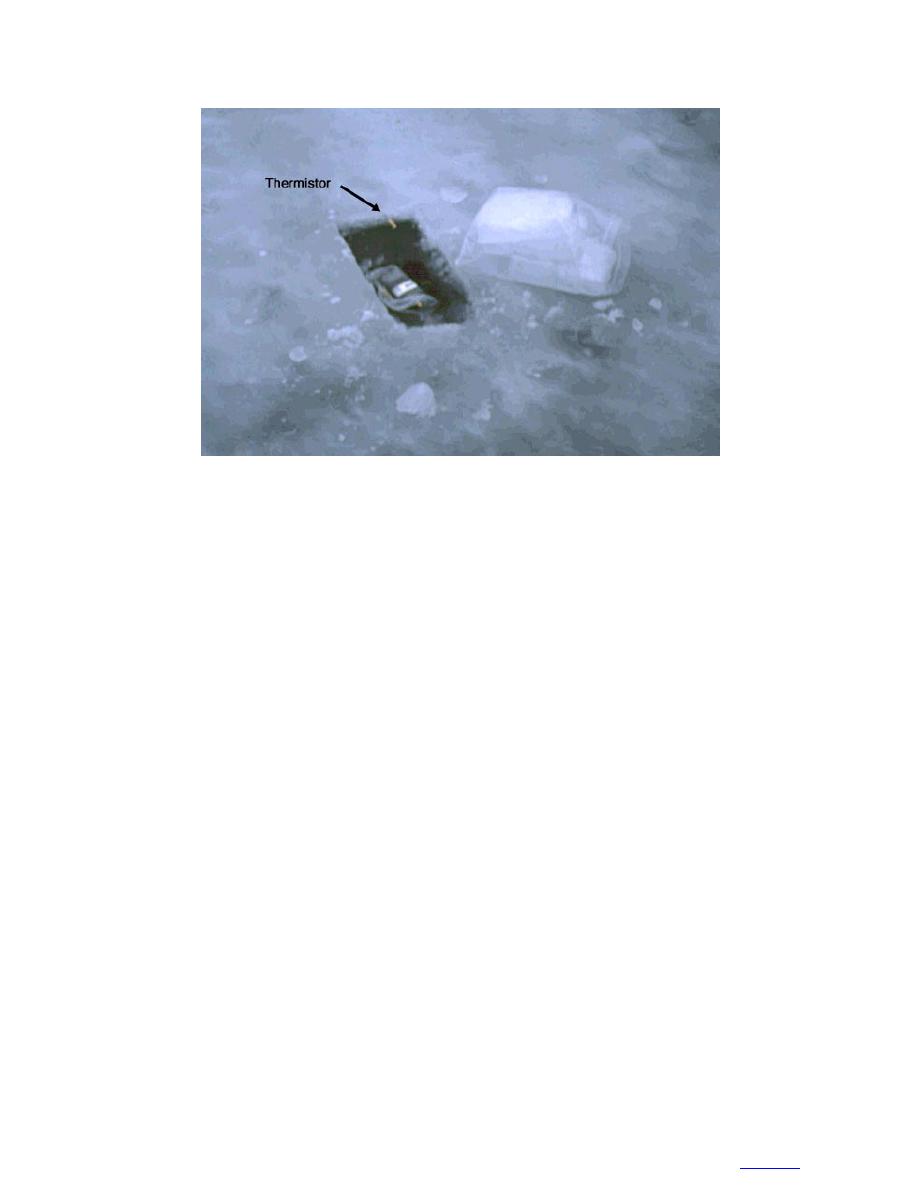
Figure 9. Ice samples in freezer bag, and thermistor for measurement of
in-situ ice temperature.
tures in the February event dropped below 9.5C and
the initial density and salinity measurements and ini-
tial observations of the crystal structure in thin sections.
remained there for several days. In both events wet bulb
Samples were prepared and analyzed in coldrooms at
temperatures always remained within a few degrees
temperatures ranging from 10 to 18C. In 1998, thin
below the dry bulb temperature, keeping relative
sections of the crystal structure were reexamined,
humidity high. In 117 cases of trawler icing along the
mainly to determine the sizes of crystals and inclusions
east coast of North America (Ryerson 1991), air tem-
peratures averaged 8.1C, with 67% of all cases
and their relationships to one another.
occurring between temperatures of 3.5 and 12.6C.
Measurements of saline ice properties and structure
are best made immediately after sampling to minimize
Studies by the Soviets indicate that icing rarely hap-
pens at air temperatures above 3.0C, and in most cases
brine drainage. Temperature changes or communica-
occurs between temperatures of 3.4 and 12.6C. Japa-
tion with the atmosphere can also cause changes dur-
ing transport and storage (Weeks and Ackley 1982).
nese research has found icing to be most severe in air
temperatures between 6.0 and 8.1C (Ono 1968).
However, careful packing and storage can minimize
problems and preserve the ice sufficiently for useful
Both of the icing events fell well within the most com-
analyses at a later time.
mon temperatures observed by other researchers dur-
ing superstructure icing events.
Hydrometeorological observations
Mean true wind speeds were approximately the same
Though there were two superstructure icing events
in both icing events, though the range of speeds was
during the USCGC Midgett research cruise, air tem-
somewhat greater in February (Table 1). True wind
perature actually dropped below the freezing tempera-
directions in both events started in the east and north-
ture of sea water (2.2C) for five periods during the
east, and rapidly backed to the north-northwest, pull-
cruise. However, only during two of these periods was
ing cold air from the Alaskan mainland and an exten-
there measurable bow spray icing, both during the
sive sea ice cover. Warming southerly winds ended both
Bering Sea portion of the research cruise.
events. Trawler icing was found to be most severe when
The weather during the February icing event was
winds were directly off of a large nearby land mass, a
considerably colder than that during the March event,
large source of cold air (Ryerson 1991).
averaging 10.2C vs. 5.6C (Table 1, Fig. 7). Mini-
Ship speeds ranged up to 8.7 m s1 in the two events,
but averaged only about 3.0 m s1 in the February event,
mum and maximum temperatures are both higher in
and 6.2 m s1 in the March event (Table 1). Average
the March event, and temperatures lingered near freez-
ing for at least 50% of the event. By contrast, tempera-
ship speeds are not very meaningful, however, because
8
to contents


 Previous Page
