coefficient ni is 0.02 for single ice layer and increases
In this case, the water level at the boom location
with the ice thickness (Shen and Chen 1992). The ni
was very high because of the assumption that an ice
value was limited to a maximum of 0.05 for multilayer
cover existed downstream of RM 13 at the start of the
ice. Water discharge was 650 m3/s (23,000 ft3/s). At
simulation. The simulated maximum water velocity near
the upstream boundary, the ice concentration is set to
the boom was only 0.6 m/s (2 ft/s), and no ice passed
be 0.45 in the main stream of the river, which gave an
the structure.
ice discharge of about 7.4 m3/s (260 ft3/s) in the
Simulation with a boom at RM 8.2
simulation.
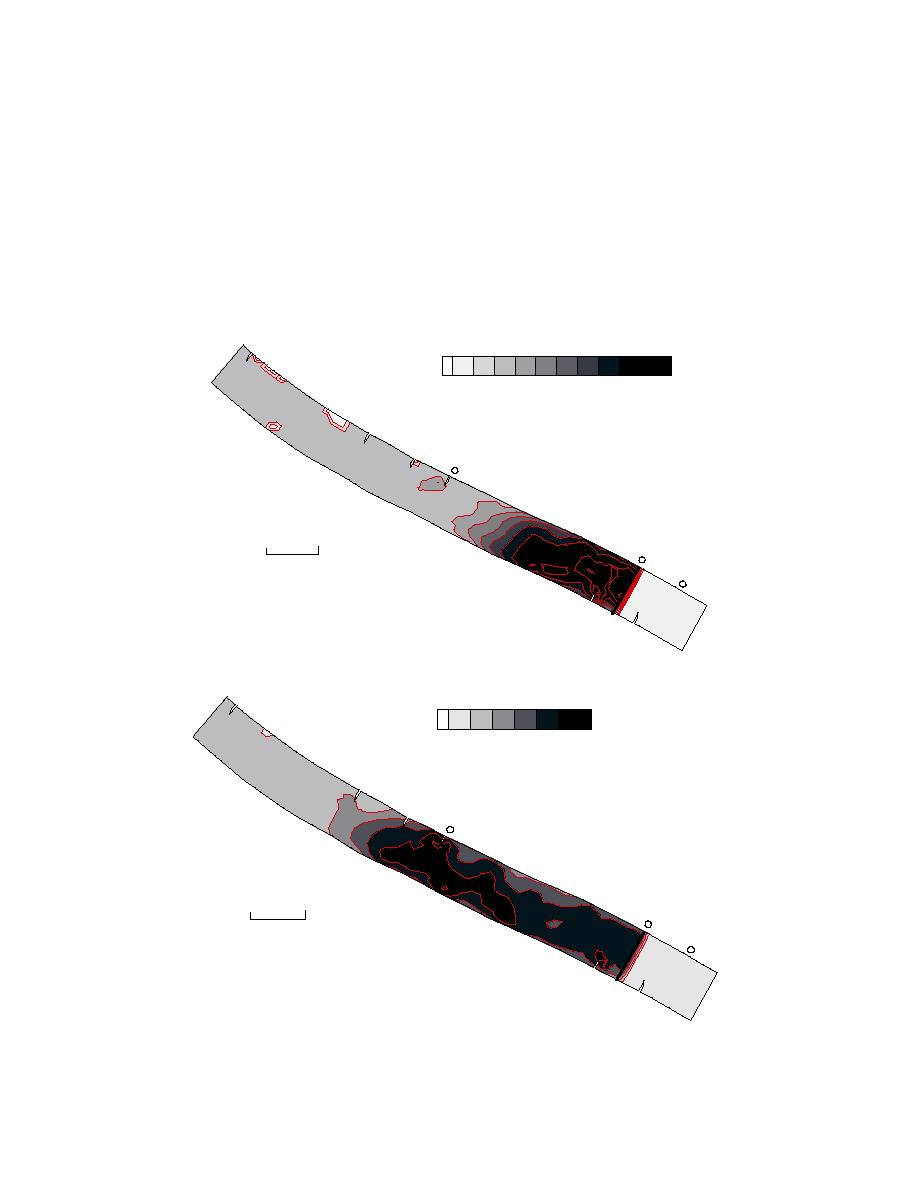
The simulated ice thickness distributions at hours
In the simulation done for domain 2 (RM 513),
10, 15, and 20 are shown in Figure 13. At hour 20 the
with a boom at RM 8.2, the downstream boundary water
simulated ice cover was about 3.2 km (2 miles) long,
level at RM 5 of 124.36 m (408 ft) was obtained from
with a thickness in the 0.6- to 0.9-m (2- to 3-ft) range.
the ICETHK simulated ice jam profile initiated at the
Ice Thickness (m)
0 0.1 0.2 0.3 0.4 0.5 0.6 0.7 0.8 0.9 1
Mile 9
0.3
0.6
300 m
8.2
0.9
Mile 8
0.9
Boom
a. Hour 10.
Ice Thickness (m) )
0 0.2 0.4 0.6 0.8 1 1.2
0.4
Mile 9
0.6
1
1
1
300 m
8.2
0.8
Mile 8
1
Boom
b. Hour 15.
Figure 14. Simulated ice thickness distribution behind the boom at RM 8.2.
20


 Previous Page
