Flow
Upper
Mississippi
River
Alton
13
Domain 1
Lock and Dam 26
Domain 2
16
8
20
5
Lewis
Bridge
St. Charles
Missouri
River
Chain of
Rapids
Canal
Flow
Lock 27
Missouri
Illinois
St. Louis
n River Miles Above the
n
Middle
Mouth of the Missouri River
Mississippi
River
0
5 mi
N
0
5
10 km
Flow
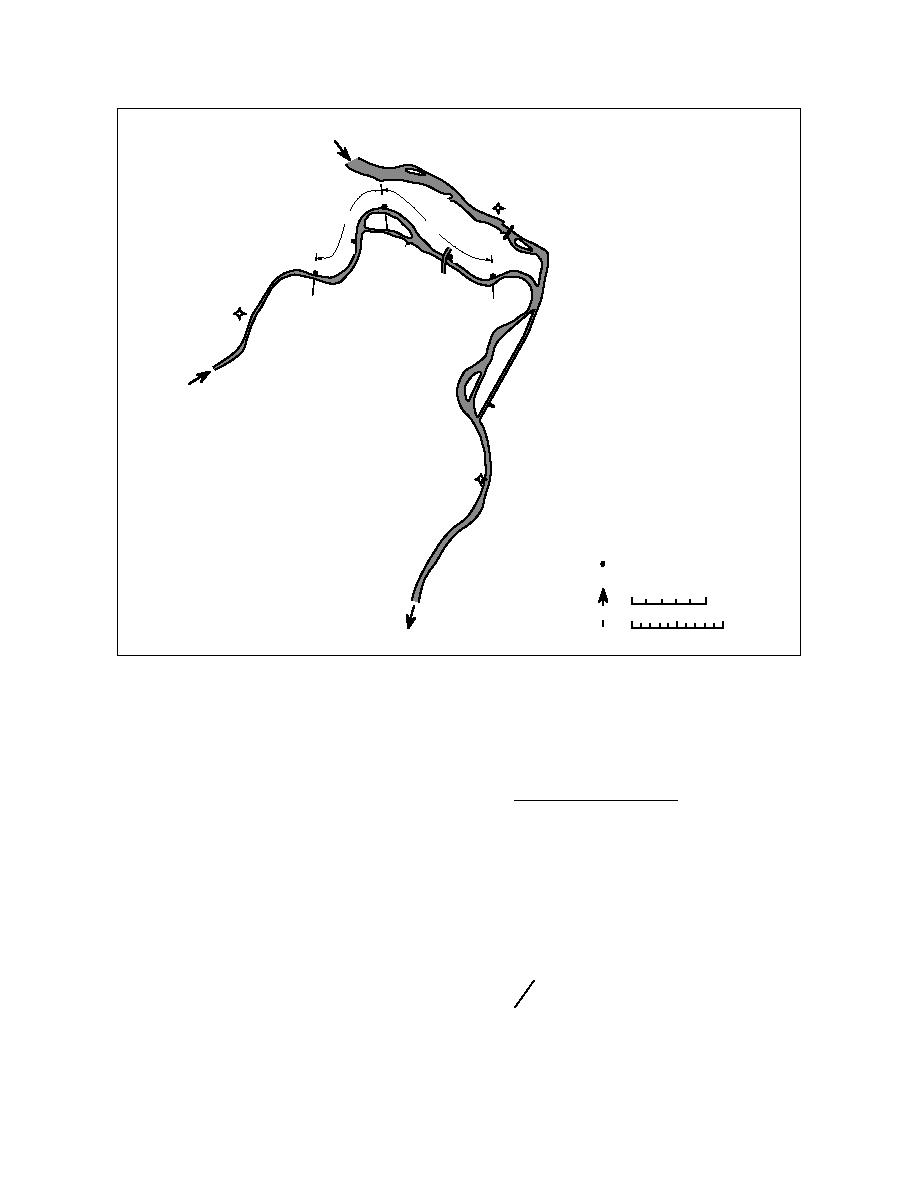
Figure 2. Study area.
written as
lake ice over the Lake ErieNiagara River Ice Boom
(Shen et al. 1997). Su (1997) further refined the model
[ρH ′ + ρti′(1 - N ) + ρiti N ]
to include the water flow in the surface ice layer, so
(1)
+
t
that grounded ice accumulations could be more
→
→
→
∇ ⋅ (ρ q l + ρ q u + ρi q ice ) = 0
accurately modeled.
In this report, the models of Shen et al. (1997) and
Su (1997) are refined to simulate the dynamic ice
in which
transport and ice jam processes. This study applies the
H′ = h + η′ = water depth beneath the ice layer
model to assess the feasibility of ice control on the lower
Missouri River using floating booms. The model
h = water depth below the reference level
η′ = elevation of the undersurface of ice
equations and numerical methods are described in the
following sections.
ti = ice layer thickness
ti′ = ρiti ρ = submerged ice thickness
Hydrodynamic model
By considering the flow in a river with an upper
ρ = water density
surface ice layer and a lower water layer, as shown in
ρi = ice density
Figure 3, the total water and ice mass conservation
equation for the case with a floating ice layer can be
N = ice concentration, i.e., the volumetric
3


 Previous Page
