Table 7. Metals determined in soil around two tank targets used for TOW mis-
sile tests.
Concentration (g/g)
Fe*
Zn
Pb
Ni
Cr
Cu
Ba
Sb
Cd
Target 1 Left rear
28,000
200
140
41
40
370
660
3.3
18
Target 1 Left front
25,000
150
17
28
24
56
550
1.3
0.43
Target 1 Right rront
23,000
300
57
45
42
260
540
2.7
2.9
Target 1 Rear
27,000
93
48
29
23
71
540
<4.0
2.9
Target 2 Rear
30,000
230
72
34
44
410
680
30
4.4
Target 2 Left front
26,000
110
19
27
25
89
490
<4.0
<0.5
Target 2 Right front
20,000
49
6.7
18
18
22
640
<4.0
<0.5
5 m out ,replicate 1
30,000
72
11
24
21
44
600
<4.0
<0.5
10 m out, replicate 1
32,000
55
7.0
23
19
35
500
<4.0
<0.5
15 m out, replicate 1
37,000
48
6.5
20
19
24
570
<4.0
<0.5
20 m out, replicate 1
36,000
52
8.3
22
19
27
630
<4.0
<0.5
25 m out, replicate 1
36,000
49
7.4
20
18
22
620
<4.0
<0.5
30 m out ,replicate 1
34,000
16
9.0
21
19
25
570
<4.0
<0.5
35 m out, replicate 1
33,000
50
8.8
23
18
20
560
<4.0
<0.5
40 m out ,replicate 1
33,000
51
7.1
20
17
25
550
<4.0
<0.5
45 m out ,replicate 1
29,000
52
11
22
19
26
580
<4.0
<0.5
50 m out, replicate 1
34,000
47
7.1
20
17
28
580
<4.0
<0.5
*Iron and barium were determined by XRF. The remaining metals were determined by atomic
absorption.
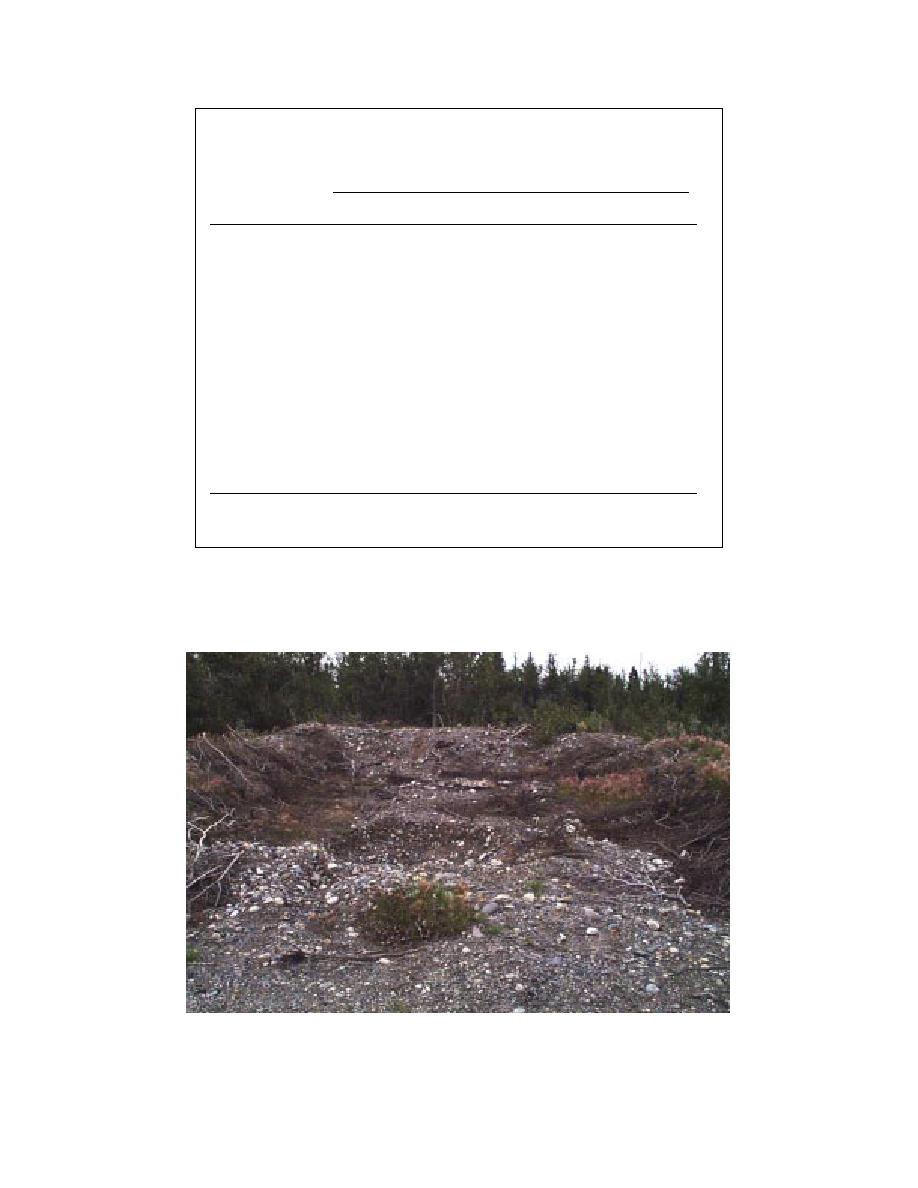
Figure 8. Revetment that concealed one of the tank targets used in SADARM
tests. We collected one composite sample along the wall of the revetment
and one from the floor of the revetment.
15


 Previous Page
