100
80
60
54
44
39
38
40
28
26
22
21
18
20
8
2
0
0
Round
Subangular
Subround
Angular
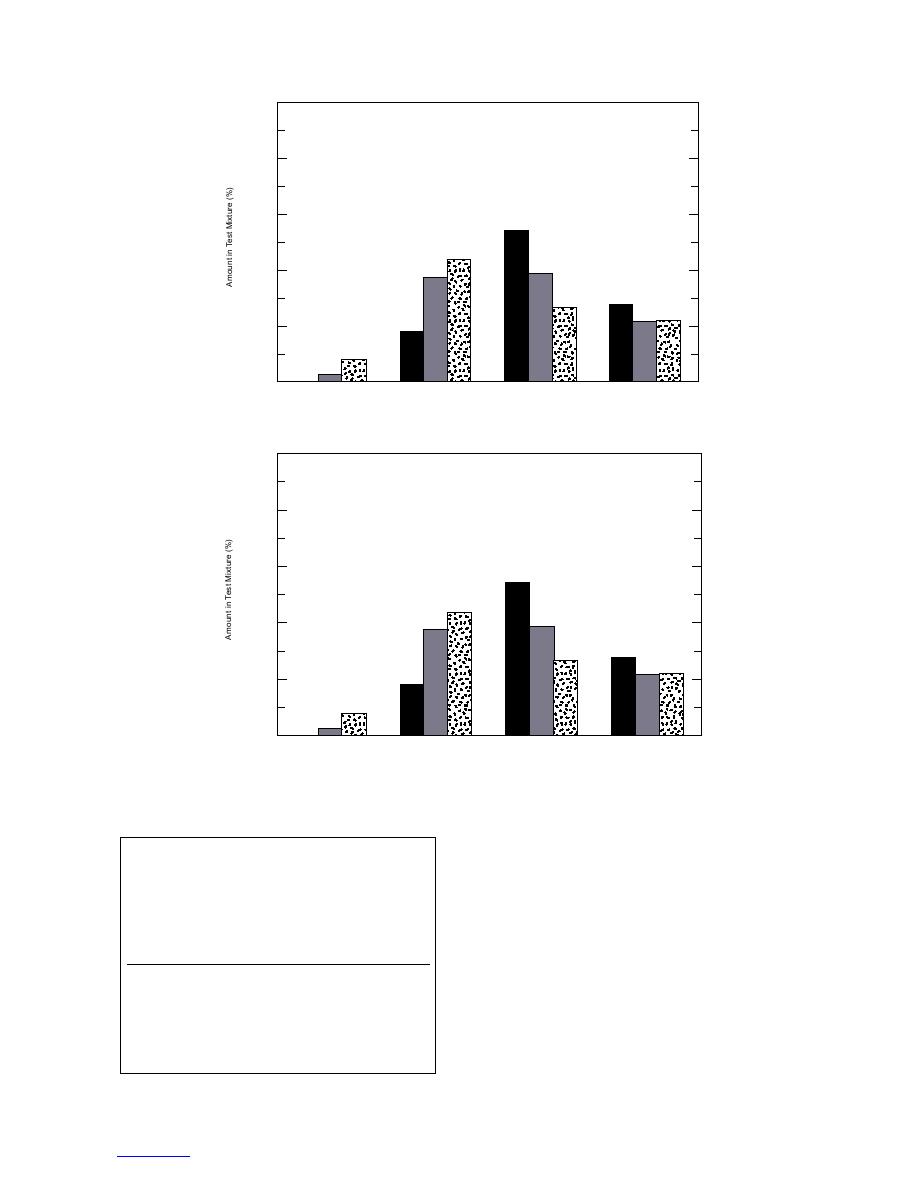
Figure 29. Examples of angularities in test aggregate.
100
80
60
54
44
39
38
40
28
26
22
21
18
20
8
2
0
0
Round
Subangular
Subround
Angular
Figure 30. Percentage of round, subround, angular, and subangular aggre-
gates in particle index test specimen.
this analysis, the bulk stress near the top of the base
Table 15. Average PI values for coarse and fine
course was around 400 kPa and was around 200 kPa in
aggregates as a function of percent crushed
the middle of the base course. We also chose these val-
aggregates.
ues because, as we saw from the results of the labora-
tory tests, the resilient modulus of the 100% natural
Voids in
Voids in
coarse
fine
material was actually higher than the 100% crushed
%
aggregates
Coarse
aggregates
Fine
material at stress levels of 200 kPa and less.
crushed
(%)
PI
(%)
PI
The resilient modulus values plotted in Figure 32
100
39.28
8.62
41.45
10.92
were taken at a void ratio of around 0.16. The results
80
39.07
8.41
show that it may be possible to use the PI as an indica-
75
38.46
7.81
40.30
8.99
tor of resilient modulus at a bulk stress of 400 kPa. At
60
37.93
7.29
200 kPa, the effect of PI on the resilient modulus was
50
36.27
5.65
41.72
11.02
25
35.39
4.80
39.66
9.62
negligible.
0
33.49
2.92
41.62
10.91
A similar attempt was made with the shear property
22


 Previous Page
