Table 7. Stream flow data for the Matanuska, Knik, and Susitna Rivers.
(After USACE 1993, p. 22.)
Minimum
Average
Maximum
flow
flow
flow
(m3/s)
(m3/s)
(m3/s)
River
Gauge location
Matanuska
Palmer
6.68
108.3
2,324.8
Knik
7 mi S. of Palmer
7.36
19.5
10,166.8
Susitna
1.5 mi downstream of
141.6
1,436.8
8,834.9
Yentna River confluence
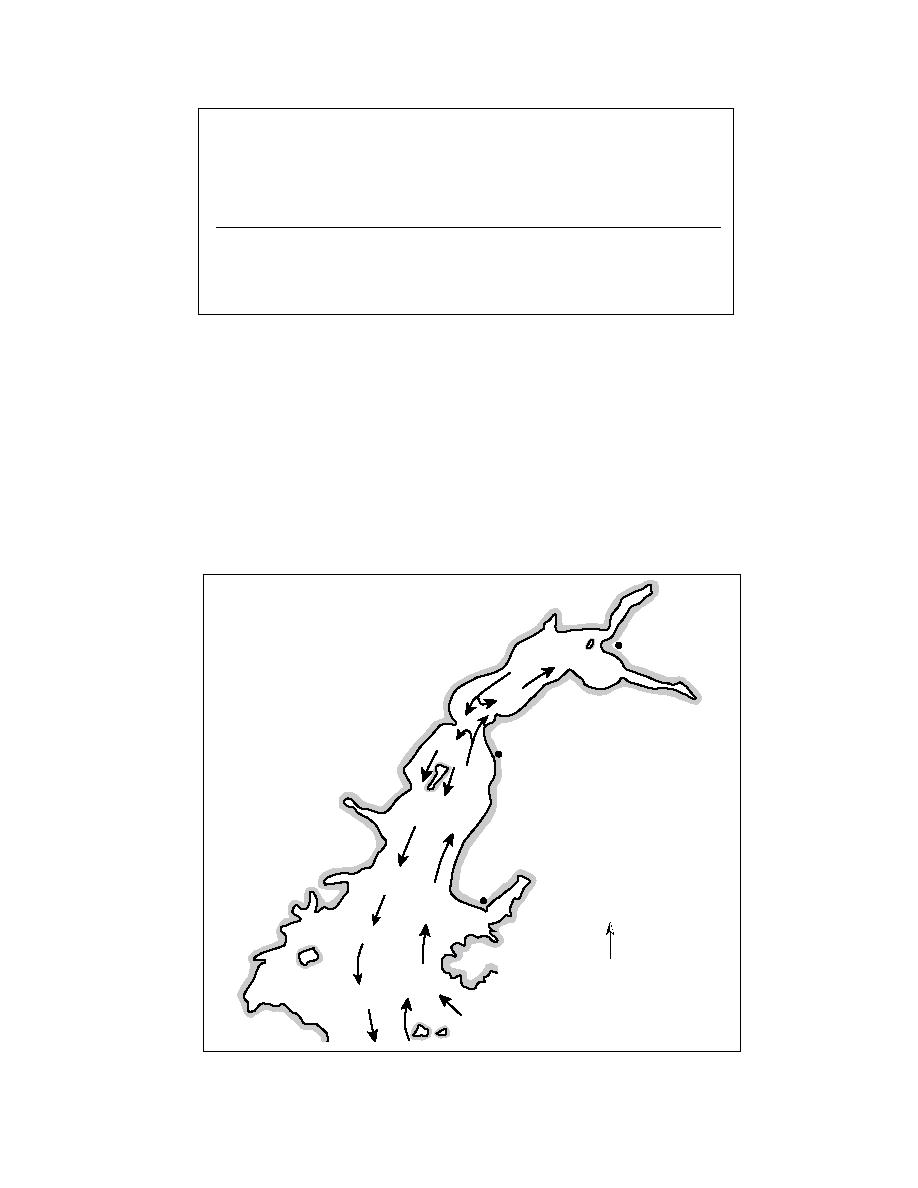
ciprocating tidal currents, follows the counterclock-
weaker than the tidal currents. The southward net flow
wise net circulation pattern shown in Figure 18. The
attains its peak intensity of about 0.2 m/s (0.4 knots)
warmer and clearer oceanic water moves up the Kenai
in summer and its minimum of about 0.1 m/s (0.2
Peninsula side of the Inlet, while the cold and sedi-
knots) in winter. At the same time the net flow of sa-
ment-laden fresh water flows toward the Gulf along
line Gulf water on the eastern side moves northward
the western side. Mean background currents (i.e., those
at 0.020.05 m/s (0.040.1 knots) to replace the west-
superimposed on tidal flow) are dominated by meteo-
ern outflow (Weingartner 1992). Between these op-
rological events with time scales on the order of 34
posing flows is a shear zone in which a portion of the
days (Muench et al. 1978) and are strongest on the
northward inflow is continually being drawn into the
western side of the Inlet. Although the background
southward outflow. This summer flow pattern for
currents near the surface have greater velocities than
Lower Cook Inlet is illustrated in Figure 19.
those deeper, they are still an order of magnitude
The Lower Inlet tends to be stratified in both tem-
Anchorage
Kenai
Homer
N
Figure 18. General surface circulation pattern in Cook Inlet. (After USACE 1993.)
55


 Previous Page
