1000
100
10
1
0.1
0.1
1
0.01
10
100
1000
HPLC (mg/kg)
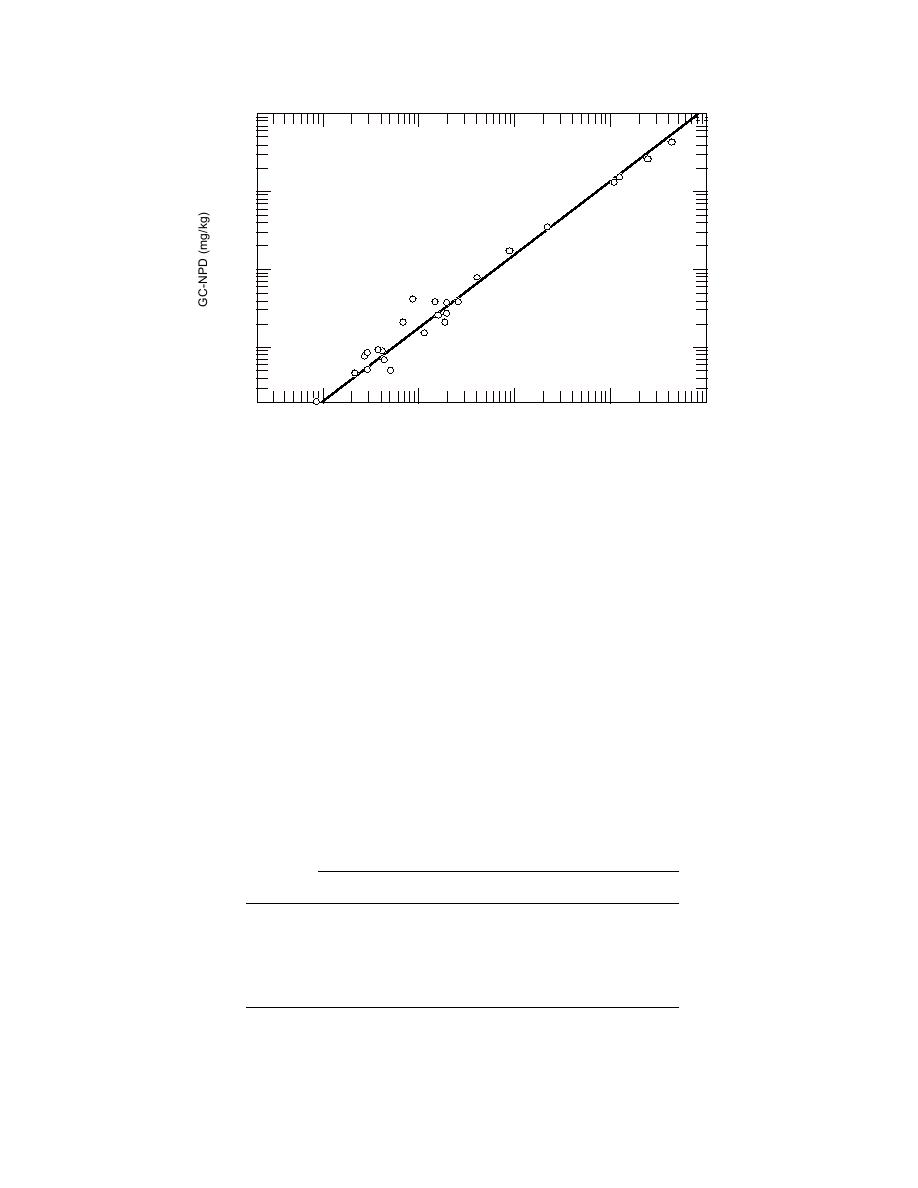
Figure 5. Comparison of target analyte concentrations (mg/kg) established by HPLC and
GC-NPD analysis of field samples.
the range tested, but the other three, less volatile,
from this later eluting compound. On the other
analytes show suppressed responses at the high
hand, excellent agreement between the methods
soil moisture contents (> 30% by dry weight). Per-
was achieved for the determination or RDX at
haps upgrading the detector with a heater would
near-detection-limit concentrations even in the
overcome this apparent suppression.
presence of high HMX concentrations.
Table 9 shows that in addition to the five target
analytes, several other compounds associated with
Miscellaneous variables
the manufacturing and degradation of explosives
The effect of soil moisture on GC-NPD response
is shown in Table 8. TNT and 2,4-DNT do not ap-
can be detected by GC-NPD analysis. The only
pear to be significantly affected by moisture over
analytes not detected by the NPD were the ortho,
Table 8. Assessment of the effect of soil moisture on GC-NPD
response.
Percent average (n = 2) response (pkht) relative to standard†
Soil
moisture*
2,4-DNT
TNT
RDX
4ADNT
2ADNT
5%
111
102
104
107
106
10%
102
100
96
104
100
20%
108
105
90
94
88
30%
102
98
81
89
84
40%
108
102
82
87
81
50%
105
100
72
83
77
*Dry weight basis.
†Responses were corrected for a proportional, volumetric dilution of acetone by water.
These corrected responses were divided by the response obtained for a standard that did
not contain water.
11


 Previous Page
