Table 4. Response factors (HP integrator peak height divided by
mg /L concentration) for RP-HPLC analysis, based on duplicate
measurements.
Response factors ( 109)
Concentration
(mg/L)
2,4-DNT
TNT
RDX
4ADNT
2ADNT
10
11.8
16.3
13.6
4.11
6.16
5
11.5
15.8
13.3
4.30
6.02
1
11.9
16.0
13.7
4.19
6.34
0.5
11.8
16.4
13.7
4.14
6.35
0.25
11.6
16.3
13.0
4.37
6.02
Mean
11.7
16.1
13.5
4.22
6.18
Std. Dev.
0.16
0.29
0.30
0.110
0.163
RSD
1.37%
1.79%
2.25%
2.60%
2.64%
between 0.39 and 0.51 mg/kg. The MDLs obtained
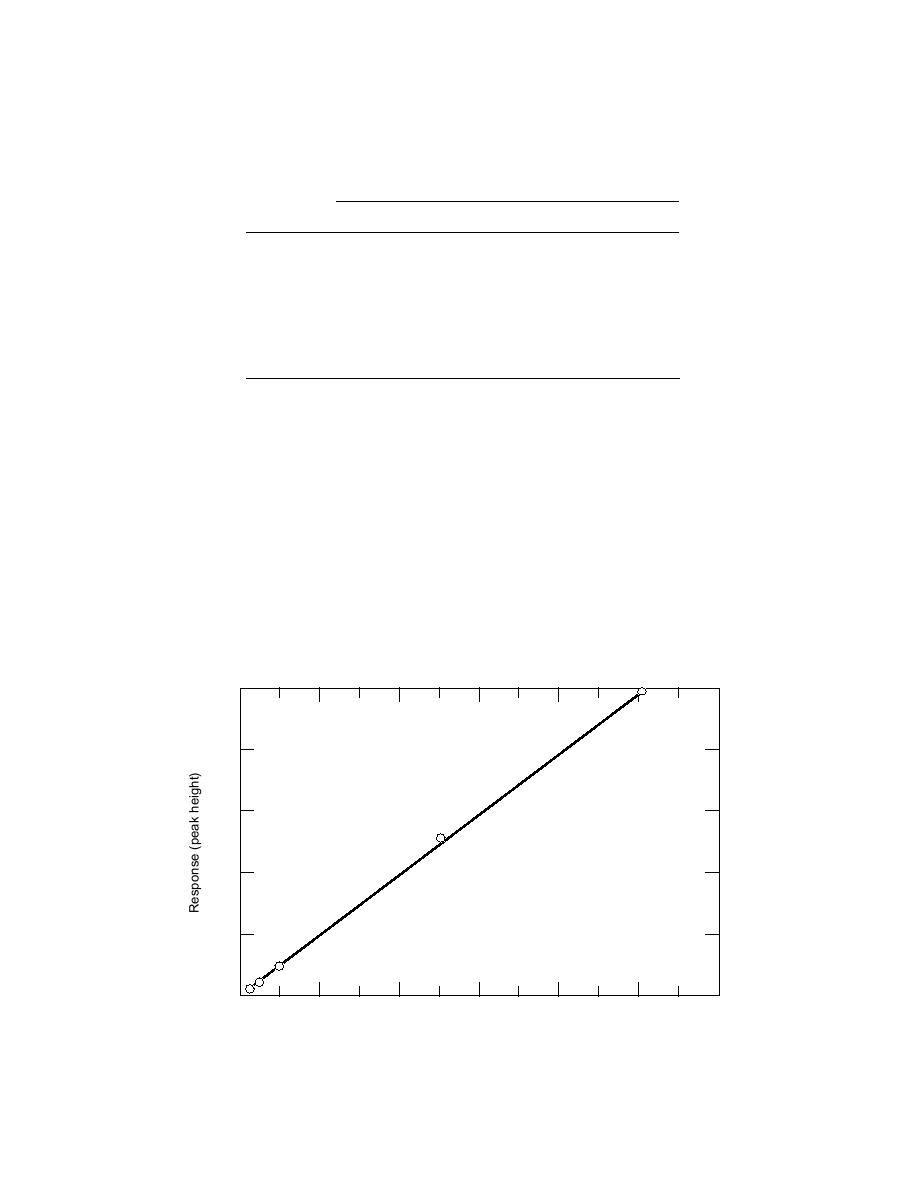
ear than that of the NPD for RDX, and likewise
from this study ranged from 0.087 mg/kg for
for the other target analytes, the NPD was deemed
4ADNT to 0.15 mg/kg for 2,4-DNT, and recover-
more practical for field applications. Moreover, the
ies ranged from 94.7 to 113%. Table 6 shows the
small nonlinearity for the NPD causes only a slight
MDL results for aqueous solutions spiked at con-
underestimation of the low analyte concentrations
centrations ranging from 2.08 to 2.71 g/L for the
(less than 1 mg/L or mg/kg). For these reasons
five target analytes. The MDLs for these aqueous
only the NPD detector was evaluated during the
samples ranged from 0.32 to 0.82 g/L. The
subsequent studies.
analyte recoveries by this method SPE were lower
than expected (61% to 71%) and will require fur-
MDL tests
ther investigation. Possible explanations for these
Table 5 shows the results of the soil MDL study
low recoveries are (1) differences in performance
for the target analytes at concentrations ranging
250
200
y = 24.567x
150
100
50
0
2
4
6
8
10
0
12
Concentration (mg/L)
Figure 3. Calibration curve obtained for RDX by GC-NPD analysis.
8


 Previous Page
