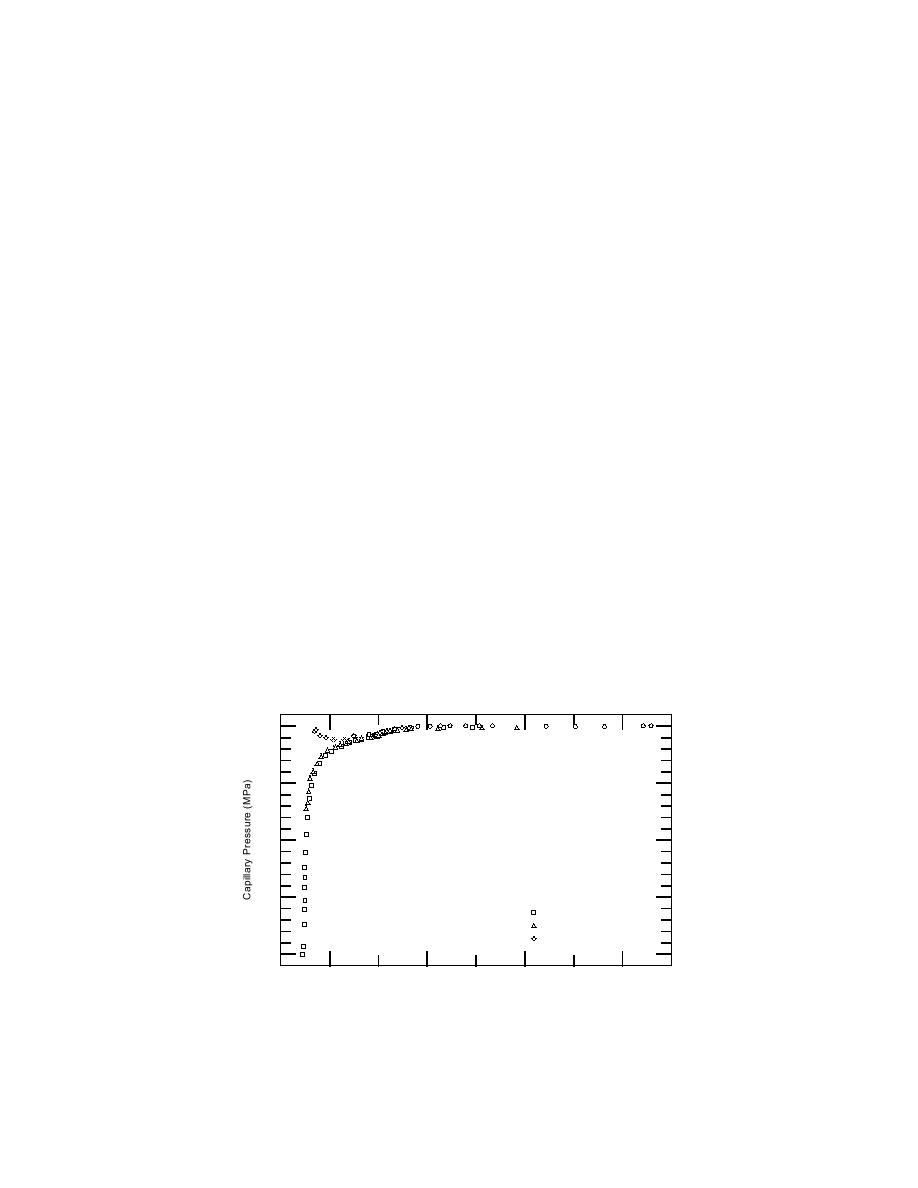
Plots of capillary pressures against liquid specific volumes
The plots of the calculated ice-solution capillary pressures against the unfrozen-
solution specific volumes are presented in the following figures. In general, these
plots indicate that the relationship between capillary pressure and unfrozen solu-
tion volume was unaffected by the composition of the liquid phases.
The pc V relationship for cooling of kaolinite pastes is presented in Figure 9.
The general trend of the data points was a single line defining the pc V relation-
ship for this material. For the kaolinite pastes that were initially equilibrated with
0.1-mol kg1 NaCl solutions, however, a pronounced deviation from this line was
apparent at the lowest unfrozen solution contents. Similar deviations were found
for some of the sand and montmorillonite pastes, but only for the pastes washed
with 0.1-mol kg1 NaCl solutions. This is apparently a systematic error, but we
have been unable to determine its source. The warming curve for the kaolinite
pastes is presented in Figure 10. No hysteresis was apparent when comparing the
cooling and warming curves of these pastes, though here again there is an appar-
ent systematic error in some of the data collected from the pastes washed with 0.1-
mol kg1 NaCl solutions.
The pc V relationships for cooling and warming of montmorillonite pastes are
presented in Figures 11 and 12, respectively. Unlike the kaolinite data, the general
trend traced by the freezing curves for montmorillonite is much less smoothly curved
than for kaolinite. In addition, there is far more scatter in the data. We believe that
the abrupt decrease in specific volumes at higher capillary pressures is due to the
large relative volume of liquid that was held in the interlamellar spaces of this
clay--in these narrow spaces, capillary forces play a less significant role in main-
taining the water unfrozen than does the so-called `surface melting of the ice' (Brun
et al. 1977, Dash 1989).
The pc V relationships for cooling and warming of sand pastes are presented in
Figures 13 and 14, respectively. As with montmorillonite, the general trend traced
by the freezing curves of this clay is much less smoothly curved than for kaolinite.
We believe that this abrupt transition is due to the coarse and fairly homogeneous
pore-size distribution of these pastes, which allowed the solutions to freeze at higher
and generally more uniform temperature.
0
10
20
30
0.001 mol kg1 NaCl
0.01
0.1
40
0.0
0.2
0.4
0.6
Liquid Solution Specific Volume (m3 Mg1)
Figure 9. Relationships between unfrozen-solution specific volumes and
ice-solution capillary pressures for kaolinite pastes cooled from 0C to
66.6C. The equilibrating solutions of the pastes were initially 0.1, 0.01,
and 0.001 mol kg1 NaCl.
21


 Previous Page
