Table 12. Core sample findings for roof D7.
Moisture
content
Thickness
(% of
TRR
Core
Insulation
(in.)
dry weight)
(%)
Status
11
EPS
6
2
100
dry
11
EPS
6
508
65
WET
11
PER (frozen)
1
116
54
WET
Notes:
The upper layer of EPS was damp on its bottom.
The lower layer of EPS was mostly frozen.
The thermal image of the entire roof, being of a
inches of hydrostatic pressure in the vertical seams
uniform tone, suggests that the lower layer of EPS
between the 13-in.- (33-cm-) high "pile" of insula-
insulation is wet over the entire roof. If this is true,
tion boards in this roof. That moisture froze at its
that is indeed unfortunate since this is a relatively
base, allowing the water above to spread laterally
new roof. Additional samples should be taken to
within the roof along the vertical seams and hori-
determine the full extent of wet insulation in this
zontal surfaces between boards. In the process, the
roof.
continuous downward vapor drive forced that
We were not able to determine the source of the
moisture into the perlite and EPS insulations
moisture found in this roof. Thermographically,
The samples taken on this roof were near its
there were no brighter or darker areas of the type
perimeter. It is possible that air infiltration at in-
that point to the membrane and flashing flaws
adequate seals between the roof and walls allowed
through which moisture is currently gaining ac-
moisture into this area, or that the amount of wet
cess. Since vapor drive is downward year-round
insulation diminished gradually with increasing
for a freezer in Texas, we do not think this is a
distance from the perimeter. These possibilities
condensation problem. We speculate that enough
further support the need for additional samples.
moisture has entered at membrane or flashing
It takes quite some time to dry out most wet
flaws on occasion in the past to create several
insulations, particularly cellular plastic insulations
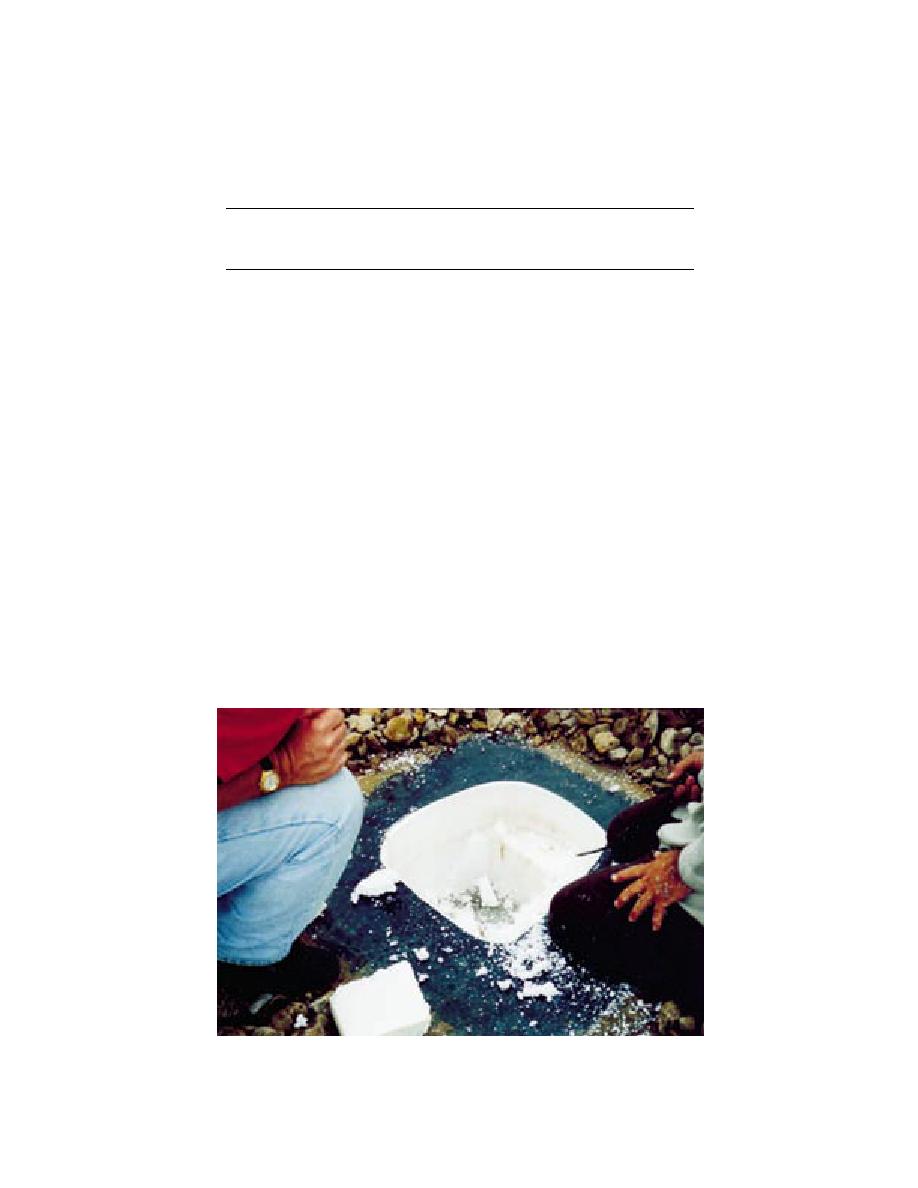
Figure 25. Taking cut F on roof D7. The lower layer of EPS was "full" of ice and
frozen to the deck. A 12- 12-in. sample of it could not be obtained.
21


 Previous Page
