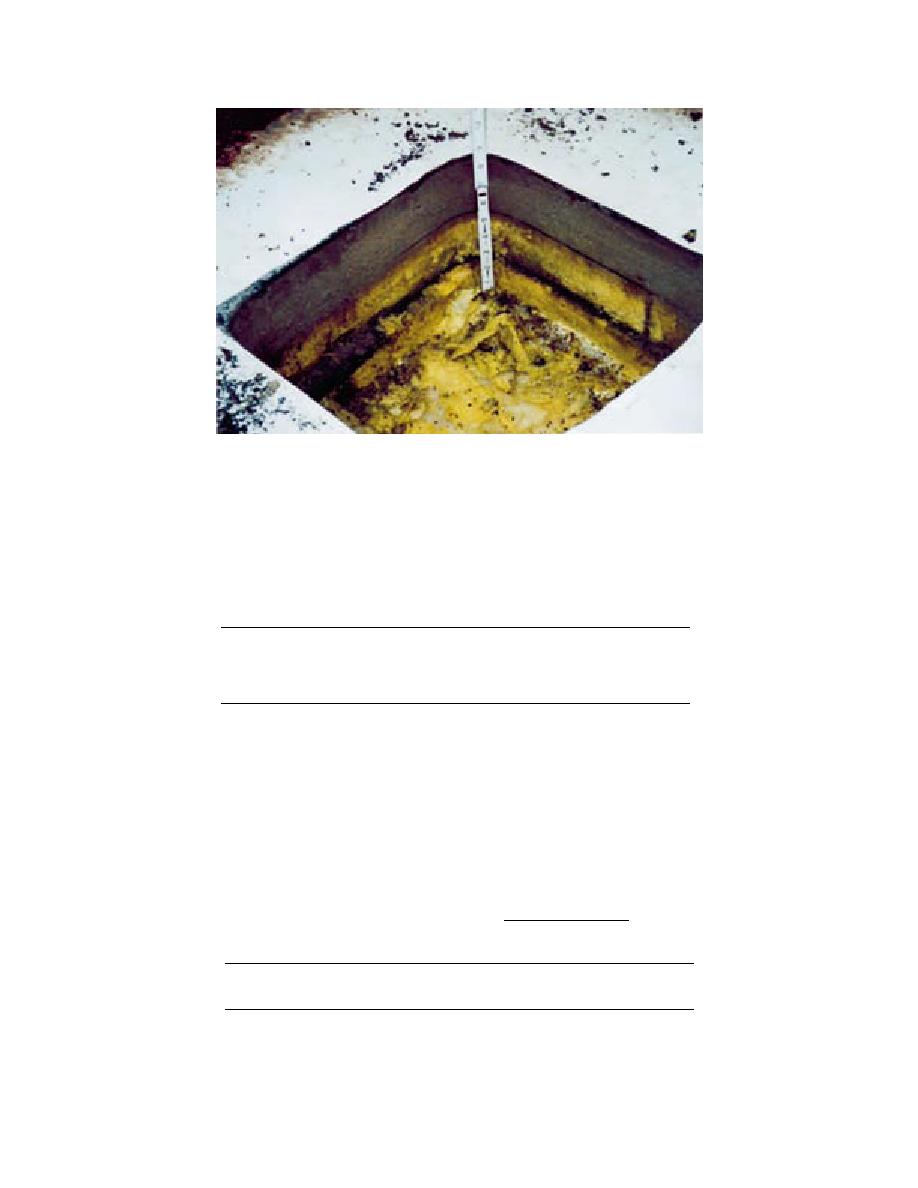
Figure 21. Cut D on roof D5 showing layers of perlite and fibrous glass insulation.
Table 8. Core sample findings for roof D5.
Moisture
content
Thickness
(% of
TRR
Core
Insulation
(in.)
dry weight)
(%)
Status
9
PER
3
1
98
dry
9
FGL
2
0
100
dry
9
FGL
0.25
327
22
WET
9
FGL
1.75
8
96
dry
Notes:
PER = perlite.
The 0.25 in. thick layer of FGL was the bottom of the top layer of FGL. The facer below
allowed water to accumulate here.
Another 0.25 in. of FGL was present below the 1.75-in. FGL listed above. A sample of it was
taken when cut D was made. It had a moisture content of 966% and a TRR of 10%; thus it
was also WET.
Table 9. Roof cut D, test results.
Moisture
Thermal resistance
content
Thickness
Density
(% of
As
After
TRR
(lb/ft3)
Insulation
(in.)
dry weight)
received
drying
(%)
PER
3
9.9
5.8
6.1
6.9
88
FGL
2
4.9
68.5
6.0
11.7
51
Notes:
Two more inches of fibrous glass were present below the insulations listed above. The
bottom of this layer contained ice and was frozen to the roof deck. Its condition is dis-
cussed in the Table 8 notes.
18


 Previous Page
