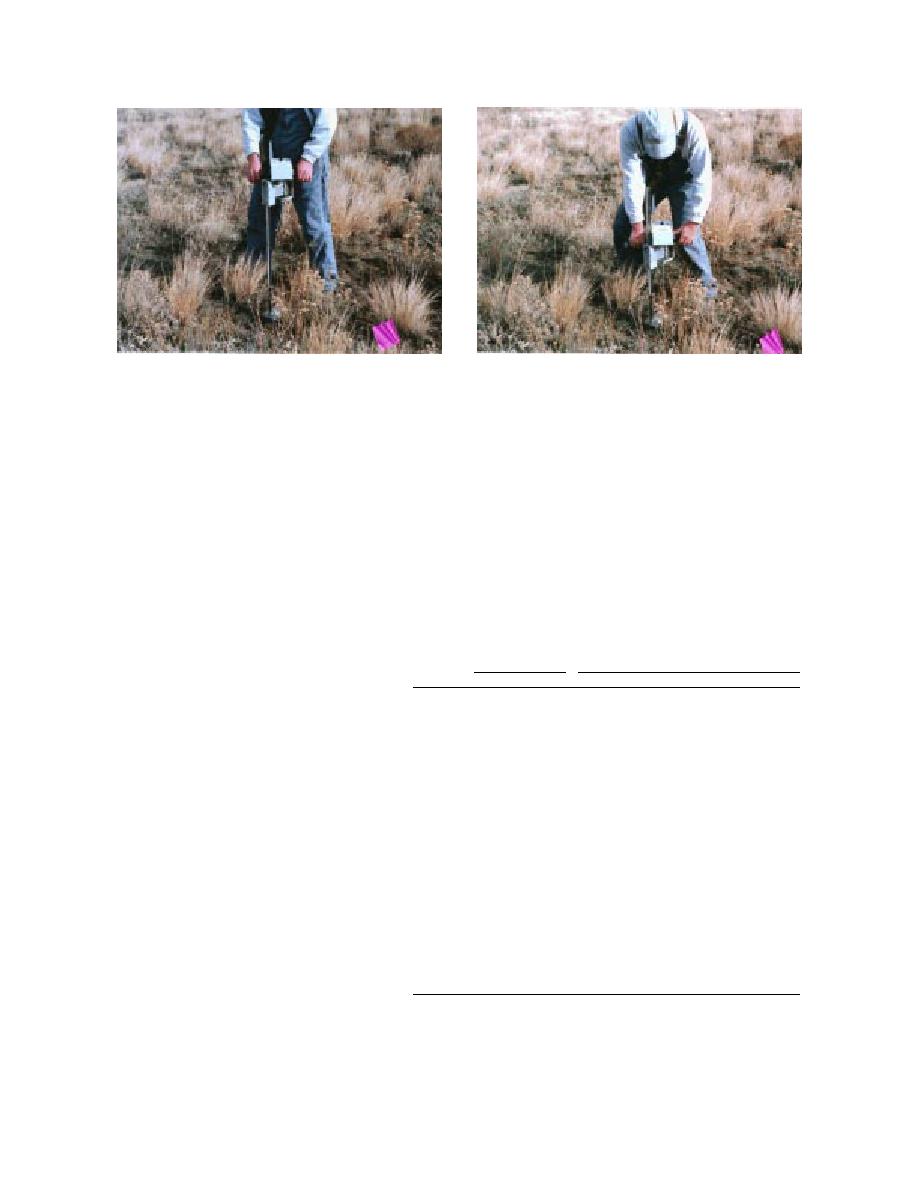
a. Before measurement.
b. During measurement.
Figure 10. Soil penetrometer and operator.
standard 15-cm deep wells using 5 and 10 cm
RESULTS AND DISCUSSION
of head (Fig. 8). From these rates we calculated Kfs,
Frost depths
expressed in centimeters/second. We collected
Table 2 lists snow accumulation and frost
data in straight ruts and turning ruts at both sites
depths at various times. However, because frost
(Fig. 4). Near the locations of these permeameter
measurements, we also collected 5- 2.5-cm cores
depths were not read daily, these data do not
show the number of freezethaw cycles at the two
of soil at different depths to determine bulk den-
sites. The frost data indicate that the soil at site C
sity (Fig. 9). At site C we took 12 cores, every 2.5
froze deeper than that at E, although this differ-
cm from the soil surface to 30-cm depth; at site E,
ence diminished later in the winter; deeper frost
6 cores every 5 cm. These cores were returned to
the lab, weighed, dried at 105C to a con-
stant weight, and then used to calculate
Table 2. Snow and frost depth.
soil moisture content and bulk density
Snow depth (cm)
Frost depth* (cm)
(dry mass per unit volume).
Date
Site C
Site E
Site C
Site E
We measured soil penetration resis-
tance (SPR) to assess soil strength and 12-11-95
6
0
0.018.2
0.0
12-15-95
0
0
5.517.5
0.0
density inside and outside of ruts as a
12-19-95
3
0
0.03.5, 6.015.5
0.03.7
function of depth close to many of the pro- 12-21.95
0
0
0.04.0, 5.513.0
0.0
file locations (Fig. 4). We quantitatively 12-28-95
0
2
0.023.0
0.010.0
assessed spatial variability and "edge" 01-02-96
0
1
1.526.5
0.09.5
effects by also measuring SPR every 15 cm 01-03-96
0
0
4.026.0
1.59.0
01-04-96
0
0
0.02.0, 5.026.0
0.09.0
along a 5.8-m transect perpendicular to 01-05-96
0
trace
0.026.0
0.01.5, 3.09.0
site E rut T-2 between rut profiles 5 and 6.
01-09-96
0
4
4.524.5
07.5
We used a hand-operated cone-type Bush 01-11-96
0
4
5.023.0
07.5
01-12-96
0
4
5.023.0
07.5
recording soil penetrometer (Findlay,
01-16-96
0
0
0.0
7.07.5
Irvine Ltd.), which measures the amount
01-17-96
0
0
0.01.5
0.0
of force required to penetrate soil (e.g., 01-18-96
0
0
0.06.5
0.0
Anderson et al. 1980, Vazquez et al. 1991).
01-22-96
10
9
0.012.0
0.06.2
The operator positioned the penetrometer 01-23-96
10
9
0.012.5
0.06.8
01-24-96
14
14
0.013.0
0.07.5
perpendicular to the soil surface and
02-27-96
7
2
0.04.0
0.05.5
pushed into the soil with a steady force
03-01-96
0
0
0.011.0
0.010.0
(Fig. 10). We used the same operator and
technique for all SPR measurements. The * Readings indicate the range of depths for frozen soil as recorded by a
frost tube. Thus a reading of 0.03.7 indicates the soil was frozen from
instrument measured SPR at 2-cm depth the surface to a depth of 3.7 cm. A reading of 0.01.5, 3.09.0 indicates
increments down to 30 cm and stored the the soil was frozen from the surface to a depth of 1.5 cm, unfrozen from
information in an onboard datalogger.
1.5 to 3.0 cm, and frozen from 3.0- to 9.0-cm depth.
7


 Previous Page
