Approximate Cocations
Site L
Site E
(not to scale)
N
∗ ∗ ∗ ∗ ∗ ∗
+
5
T4
April 1995 Track
+
123456
+
(T4)
4
July 1994 Track
+
Site E Schematic
3
Approximate Locations
N
(not to scale)
2
1
Turn 1
x
x
Turn 3
x
3 4 5 x6
12
x
∗ ∗
∗ ∗ ∗x+
x∗
∗2
T2
3
∗1
x+
x
∗ ∗ ∗ ∗ ∗ ∗
x
T2
x
∗
x
12
3456
x
Frost Tube
++
x
Bulk Density Core
x
+ Kfs Well
x
x
SPR
Rut Profile
Frost Tube
∗
Rut Profile and SPR
Bulk Density Core
+ Kfs Well
x
SPR
30 m
Rut Profile
∗
4
∗ ∗
Rut Profile and SPR
3
Turn 2
2
∗
50 m
1∗
∗
Turn 1
12
Slope
Direc
tion
∗
+
1234
56
∗ ∗ ∗ ∗ ∗ ∗
+
∗
T8
6
∗
∗
∗
5
4
Turn 2
3
Slope Direction
2
1
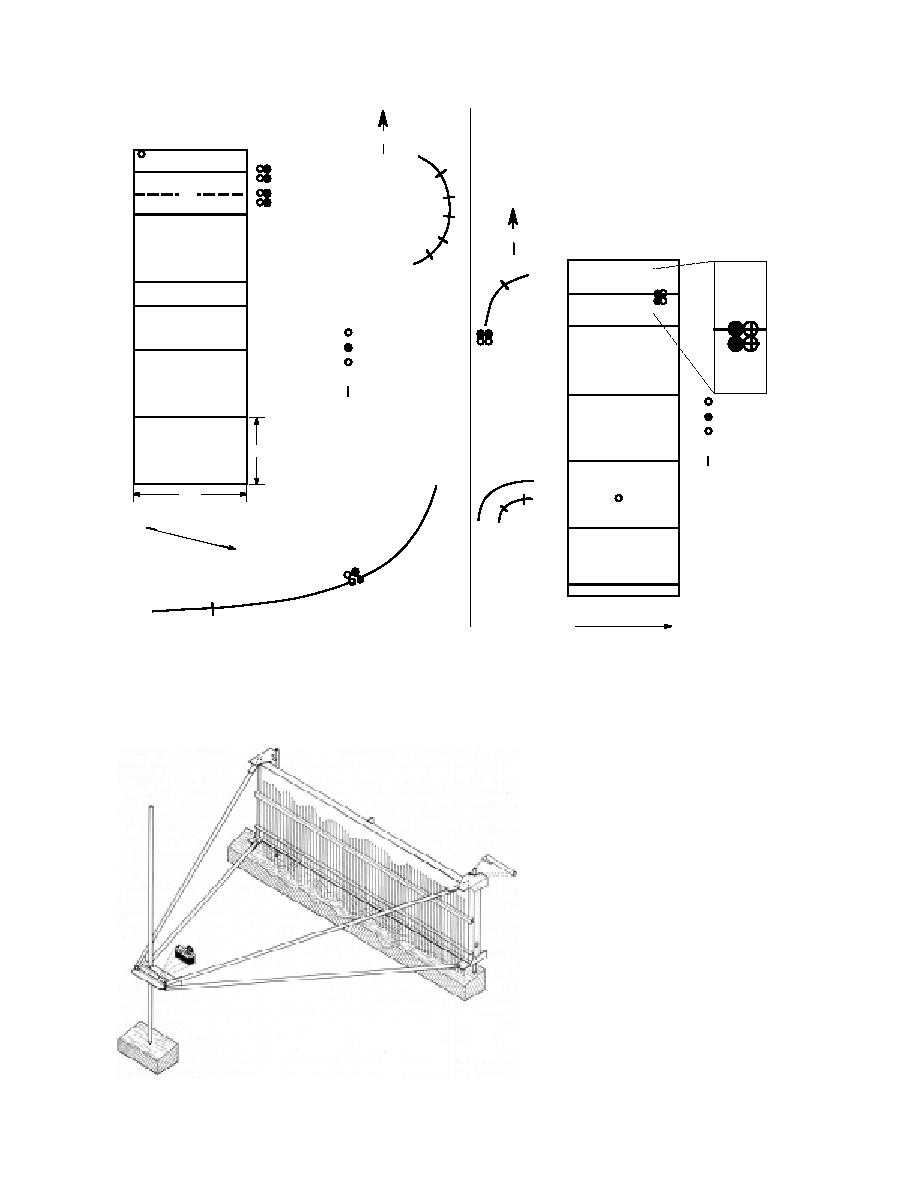
Figure 4. Rut profile transect and soil property measurements locations; the symbol ⊕ indicates the approximate
locations of Guelph permeameter wells, are soil cores to calculate bulk density (BD), and x indicates permeame-
ter locations (SPR); drawing is not to scale.
Figure 5. Schematic of a portable photographically
recording profile meter (from McCool et al. 1981).
4


 Previous Page
