180.00
160.00
140.00
120.00
100.00
Lip
80.00
Uncompacted
Sidewall
Zone
60.00
40.00
Center
20.00
0.00
0
50
100
150
Distance (cm)
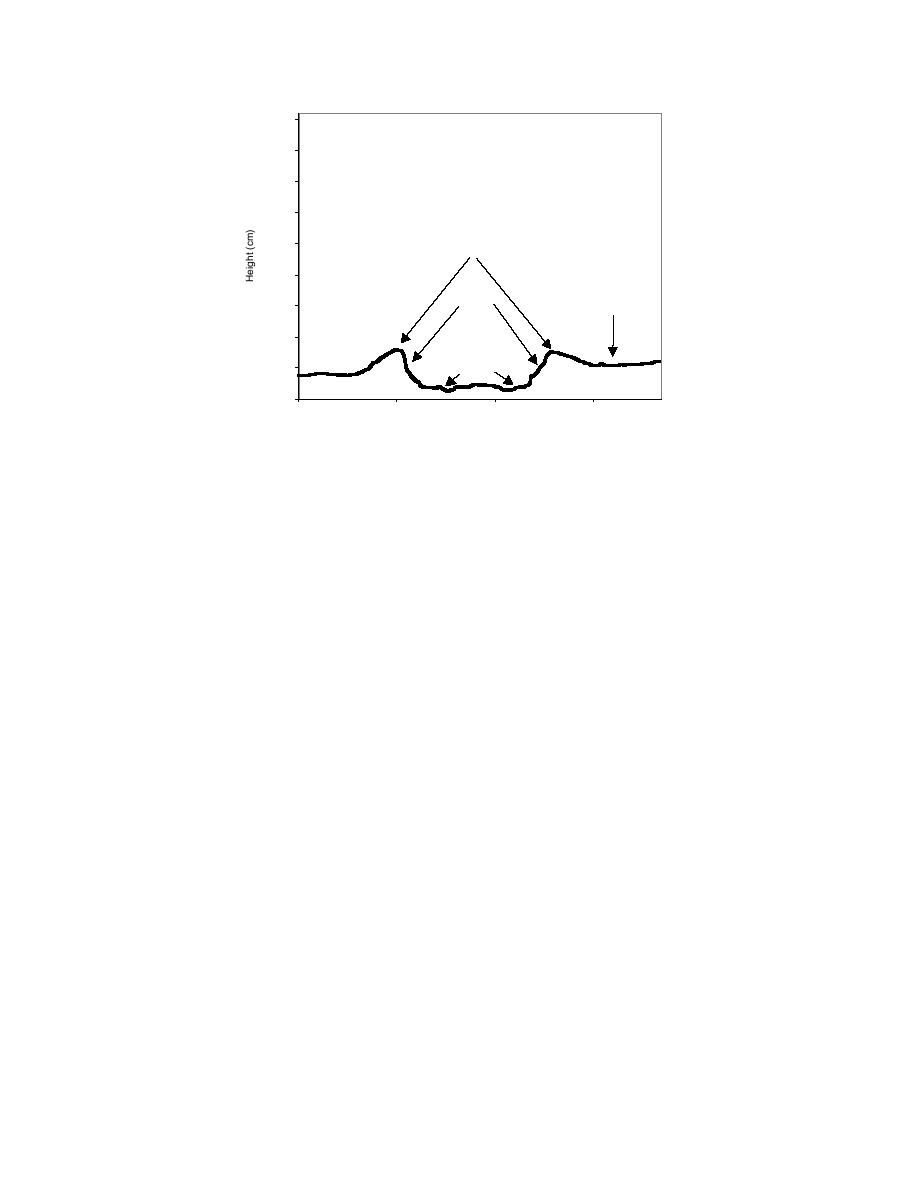
Figure 11. General cross-sectional shape of an M1 Abrams tank rut.
at site C is expected because it is cooler than site
lip more pronounced than the other lip (e.g.,
E. One implication of a deeper frost depth is that
Appendix A, turn C 1-4, Appendix B, turn E 2-4).
possible freezethaw effects can extend farther
A two-way ANOVA was used to test if there
into the soil profile at site C than site E. However,
were overall profile differences between sites or
changes in soil compaction and rut profile may
between straight and turning ruts on 8 December
relate more to the number of freezethaw cycles
1995, the initial sampling date. The average com-
than the depth of freezing. Both sites had days
bined rut-profile standard deviations, 4.16 cm at
when a thawed layer of soil was observed between
site C and 4.38 cm for E,were not significantly dif-
two frozen layers, indicating periods of partial,
ferent from each other (P = 0.35). However, turn-
shallow thawing followed by refreezing. An
ing rut profiles had significantly higher average
important implication of deeper frost at site C is
standard deviations than straight ruts at both sites
that water infiltration, from melting accumula-
(P < 0.001): 5.26 cm for turning ruts and 3.15 cm
tions of snow in spring, may be impeded by a
for straight ruts at C; 6.44 cm for turning ruts and
subsurface lens of ice for longer time than at site
3.26 cm for straight ruts at E. The interaction term
E. If the soil moisture is already high in these soils,
between site and rut type was not significant (P
there will be increased potential for erosion from
= 0.52), indicating that individual comparisons of
surface flow.
turning ruts and straight ruts between sites did
not differ from the combined analysis.
Analysis of combined data over time with the
Rut profiles
M1 tank ruts at YTC are characterized by a
Friedman test, a nonparametric analog of a
depressed, compacted zone, about 64 cm wide,
repeated-measures ANOVA, indicated average
formed as the passing tank compresses the soil
standard deviations of combined data decreased
(Fig. 11). The rut depressions typically range from
significantly during 1996 (P < 0.001), 4.31 cm on
about 2 to 15 cm deep and often reveal the details
8 December 1995, 4.03 cm on 27 March 1996, and
of tank track patterns. A combination of shallow-
3.77 cm on 16 July 1996. However, changes in indi-
shear failure and unconfined compaction from the
vidual ruts during 1996 varied from slight (e.g.,
track can result in relatively steep rut sidewalls,
App. A, C T 4-1, App. B, ET 8-2) to significant (e.g.,
capped by a lip raised as much as 1020 cm above
App. A, turn C 2-4, App. B, turn E 2-4). The
the adjacent, unrutted soil. The soil surface out-
KruskalWallis one-way analysis of variance and
side this raised lip is uncompacted. Turning ruts
the KolmogorovSmirnov two-sample test indi-
sometimes exhibit an asymmetric profile with one
cated that turning ruts changed significantly more
8


 Previous Page
