Treatment results
shorter half-life. Sampling locations and results
Microbial activity. First year data from the
for paired soil hydrocarbon analyses are shown
University of Alaska cooperators in this study
in Table 1. These tests indicated a decline in soil
revealed no increase in mineralization potentials
hydrocarbon concentrations through the two
or microbial numbers attributable to the addition
seasons.
of nitrogen, irrigation, or tilling (Rawls-McAfee
Organic vapor emissions. These results are shown
and Brown 1992). In 1992, 180 soil samples were
in Table 2. Organic vapors were detected at low
collected for radio-respirometric assays (Brown
concentrations in 4 of the 25 samples analyzed.
et al. 1991) and sheen screen analysis. The results
Additional soil organic vapor analysis typically
indicated an increase in the mineralization po-
resulted in low levels.
tentials and numbers of microorganism, which is
consistent with biodegradation.
Infiltration gallery
The infiltration gallery is a dynamic in-situ
Contaminant levels. Soil carbon levels showed a
treatment system designed to stimulate hydro-
decline in organic carbon and the TPH levels
carbon degrading bacteria by circulating nutrient
through 1991 and 1992 (Fig. 5). To address the
and oxygen-amended water through petroleum-
spatial variability issue, CRREL researchers esti-
mated biodegradation rates from a 25-point grid
contaminated soil. The infiltration gallery was
on a 1-acre (4047-m3) landfarm. A variety of ana-
installed in the area of the fuel spill next to the
railroad tanker body. The soil excavated from
lytical means were used. The simplest and least
this area was moved into the landfarm for treat-
costly method, using dichromate oxidizable car-
ment, and the infiltration gallery was used to
bon, yielded estimated degradation rates that
treat the surrounding soil that was less inten-
varied substantially throughout the site.
sively contaminated. The infiltration gallery has
Three critical observations were noted. First,
a groundwater pumping well located down-
the degradation of organic carbon was readily
gradient from the location of the spill. Nutrients
measured, even though with a relatively crude
are added to water pumped from the well. The
technique such as dichromate oxidizable carbon.
water is then infiltrated from a 20- by 100-ft (6- by
Second, the measured degradation rates, expressed
30-m) gallery through petroleum-contaminated
as half-lives, varied by seven-fold within a 1-acre
(4047-m3) site. Third, there was a pattern in the
soils. Oxygen is added to the water within the
infiltration gallery by aeration.
variability; the center of the site had a much
Table 2. Results of organic vapor meter survey for the landfarm, 18
August 1992.
Conc.
Conc.
Conc.
Conc.
Conc.
Loc.
(ppm)
Loc.
(ppm)
Loc.
(ppm)
Loc.
(ppm)
Loc.
(ppm)
1
0
6
1
11
5
16
0
21
0
2
0
7
20
12
0
17
0
22
0
3
0
8
0
13
0
18
0
23
0
4
0
9
0
14
0
19
0
24
0
5
0
10
0
15
0
20
0
25
0
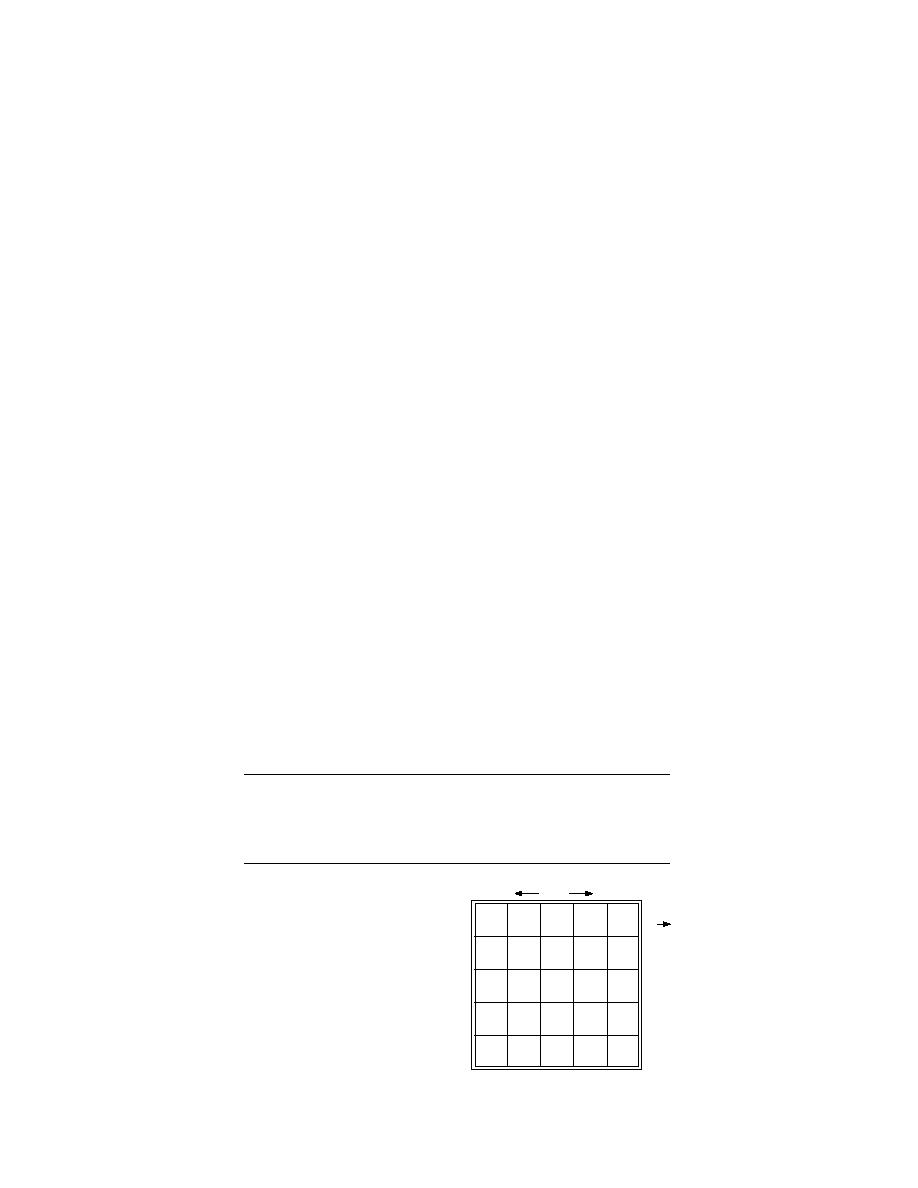
Location Numbers
190 ft
25
20
10
5
15
N
24
19
14
9
4
23
18
13
8
3
230 ft
22
17
12
7
2
21
16
11
6
1
Access Road
11


 Previous Page
