300
95
9
0.9
2=
,R
ne
e
nz
200
Be
3
8
.99
2=0
R
E,
TC
0
Toluene
998
0.
R2=
R2=0.9980
E,
TDC
p-Xyl
2=0.9980
R
100
975
0.9
R2 =
,
PCE
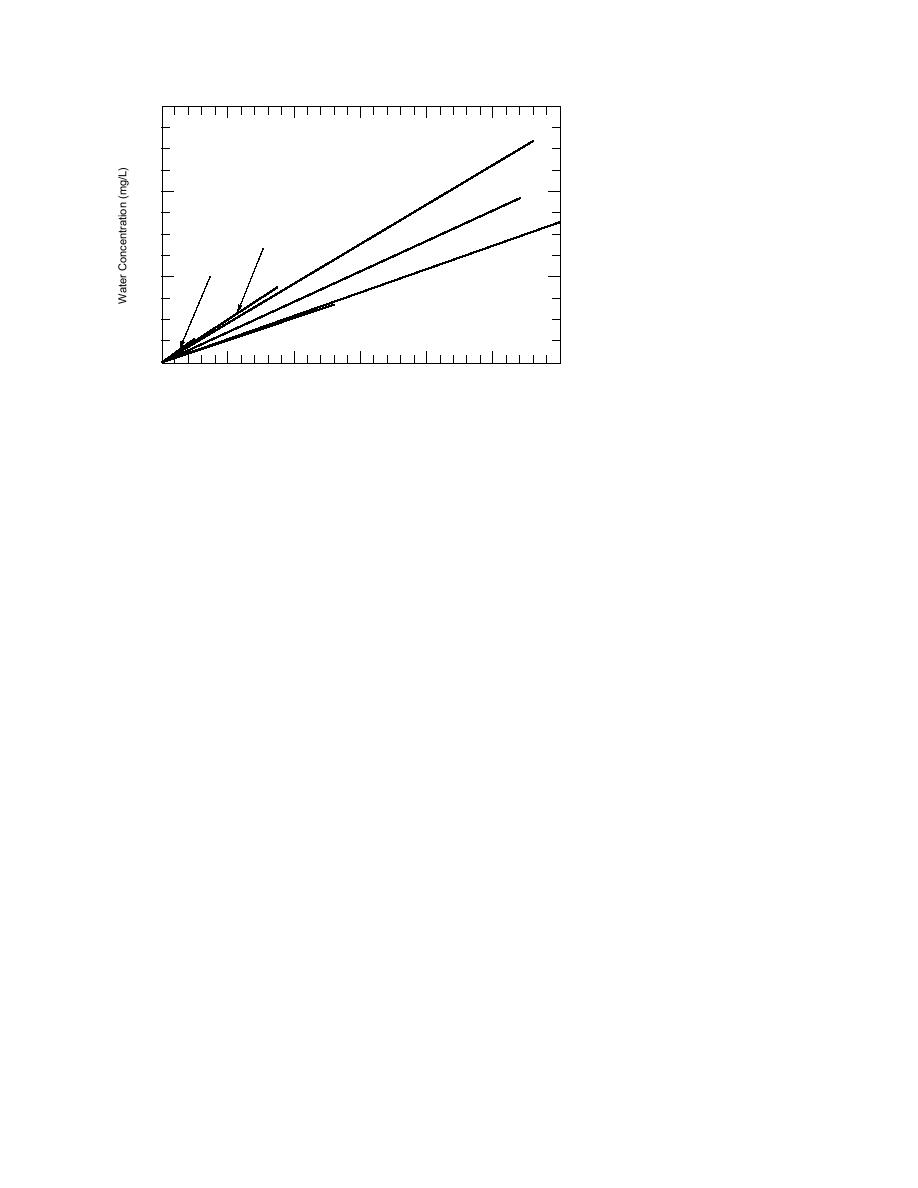
Figure 2. Linear partitioning between
0
chamber vapor and membrane-
5
10
15
20
25
30
0
covered water samples.
Chamber Vapor Concentration (mg/L)
centrations has been observed. Therefore, not only
compounds, therefore creating a condition where
the water inside the membrane covered vials was
were these five experiments with the lowest ana-
exposed to an enriched vapor concentration.
lyte concentrations more susceptible to biodegra-
Aside from this experimental artifact, the relative
dation, but the rate of biodegradation was greater
standard deviation for the mean values was
than the rate of analyte diffusion. Because of the
always ≤17%, and often <10%. Therefore, consis-
impact of biodegradation on the aromatic hydro-
tent with the principles of Henry's law, constant
carbon, only the chlorinated compounds were
(or linear) partitioning was empirically estab-
evaluated for the soil samples in experiments 15.
lished over the concentration range tested (Fig. 2).
As with the water samples, the mean of the soil
Duplicate water samples and, in some cases soil
sample duplicates was used for subsequent data
samples, were included in the experiment in order
interpretations.
to assess the precision of this experimental
Close inspection of the analyte soil concentra-
approach. Overall, the differences among dupli-
tions reported in Appendix A shows that the effect
cates was small; however, differences among the
of moisture was not always consistent. Two gen-
duplicate water samples were generally smaller
eral trends were 1) as the moisture content
than for the soil samples. The discrepancy in preci-
increased, analyte concentrations decreased for
sion between these two matrices was probably
the CR-S soil, and 2) while the CR-D soil showed
due to inconsistencies associated with packing a
increasing analyte concentrations with increasing
soil into a small vial and losses due to the biologi-
moisture content. There were no trends with
cal degradation of the aromatic compounds (i.e.,
regard to moisture in the majority of cases for the
Ben, Tol, and p-Xyl).
Wis soil.
The amount of water remaining at the end of the
The inconsistencies in trends between soil
exposure period for the three moist soil conditions,
moisture and analyte concentrations may have
and movement of water vapor onto the initially air
been caused by either poor seals between the vial
dried soils, made all of the mineral surfaces
rim and membrane, or inconsistencies in vial
hydrated. The presence of moisture and oxygen
packing. To avoid this potential experimental arti-
created conditions conducive to microbiological
fact and suppress the influence of moisture
degradation processes (Atlas 1981). Consistent
altogether, the concept of using a mean value was
with these conditions, several very low or nonde-
considered. Before taking this step, the ratio of
tectable concentrations for Ben, Tol and p-Xyl
high to low analyte concentrations for a soil in
were established for soil samples from experi-
each experiment was first evaluated. The results of
ments 15 (App. A). Although not anticipated,
this analysis, with the omission of the saturated
especially for the CR-D and Wis soils, losses of aro-
condition for the CR-S soil, showed the ratio to be
matic hydrocarbons and persistence of chlorin-
a factor of three or less (75 out of 99 cases, Table 5)
ated compounds are consistent with an earlier
for most cases. Therefore the use of mean values
study (Hewitt 1996). Furthermore, the diminish-
could be justified by accepting an uncertainty of a
factor three (3). Further justification for omitting
ing of biodegradation losses at high analyte con-
6


 Previous Page
