Average CO values can be deter-
90
mined based on the mean or median,
TCE
in the case of a lognormal distribu-
4
68
0.9
tion, physical properties of soils and
2=
R
S,
reported KH and KOC values for
-
CR
60
organic compounds. When Rong
(1996) performed this analysis for 55
soils with a median organic carbon
content of 0.14%, the CO values
listed in Table 7 were obtained. His
30
8
study, which involved several more
2=0.987
Wis, R
VOCs than listed in Table 7, pre-
2=0.9950
CR-D, R
dicted that extremely volatile com-
pounds with high Henry's law con-
stants would have high CO values.
0
5
10
15
20
25
30
0
Conversely, compounds with ex-
Chamber Vapor Concentration (mg/L)
tremely low volatility and low Hen-
ry's law constants would have low
100
CO values. Furthermore, that the
92
.98
TDCE
most frequently occurring soil con-
0
2=
80
,R
taminants, i.e., TCE, PCE and Ben
-S
CR
(Plumb and Pitchford 1985), would
have CO values of around one.
60
Experimental estimates for CO
can be calculated using the mean
993
bulk soil concentrations in Table 6
2=0.9
40
D, R
CR-
(unsaturated CR-S soil values only)
.9943
and the chamber vapor concentra-
R2=0
Wis,
tions listed in Appendix A. These
20
experimental CO values (see Table
8), although sometimes not as pre-
cise as the Henry's law constants
0
0
10
20
30
40
50
60
70
80
90
shown in Table 4, also resulted in
Chamber Vapor Concentration (mg/L)
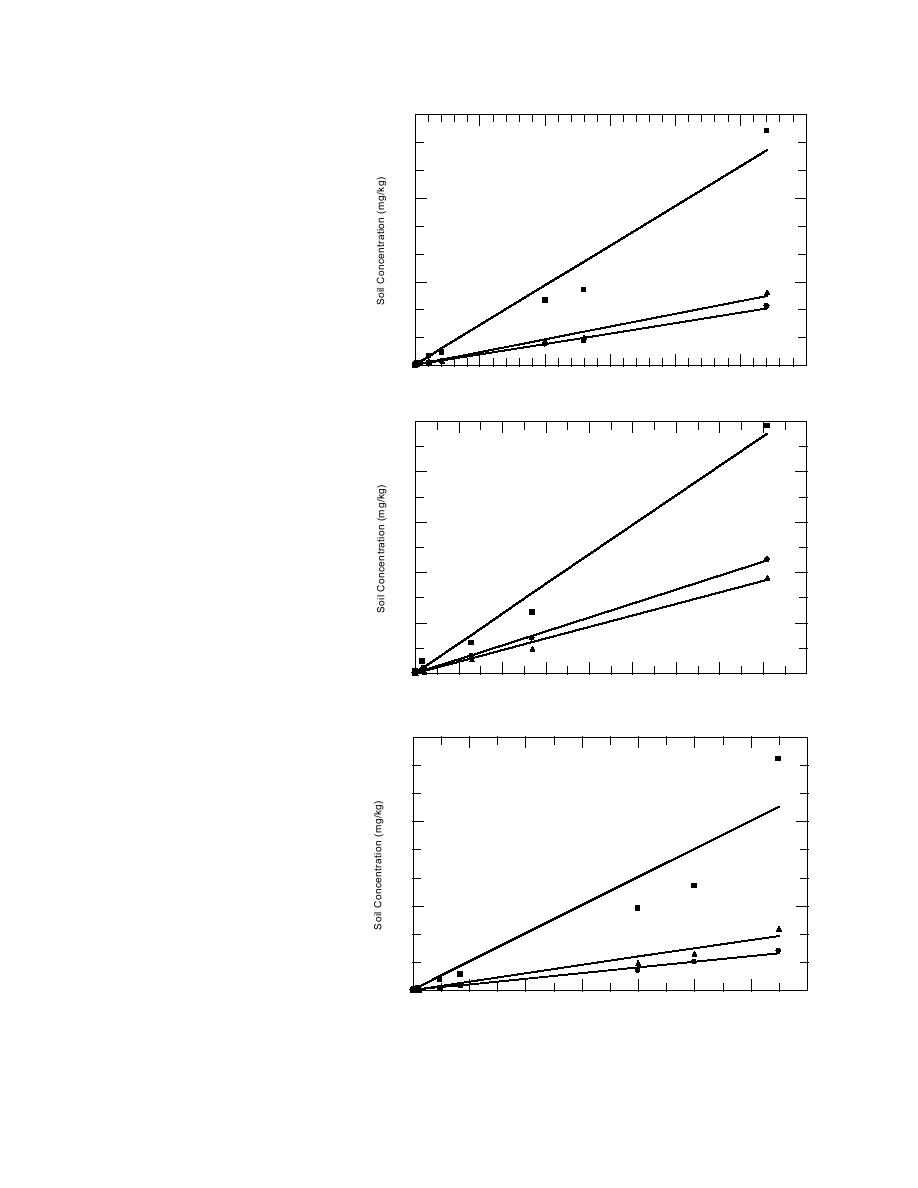
fairly constant ratios (linear parti-
tioning) suggesting that proportional
90
constants exist between these two
media (Fig. 3). With regard to soil
PCE
type, the mean ratio for the unsatur-
ated CR-S soil was always signifi-
3
99
cantly different at the 95% confi-
0.8
60
2=
R
dence level from the other two soils,
-S,
CR
while the CR-D and Wis soil were
only significantly different from
each other for two of the six analytes
tested. The lower ratios for the CR-S
30
soil were due to its higher analyte
2=0.9667
Wis, R
sorption capacity, i.e., organic car-
bon content. More importantly,
2 0.9892
CR-D, R =
ratios for the two low organic car-
0
bon (<0.2%) soils in Table 8 show
0
2
4
6
8
10
12
14
values that are close to unity for
Chamber Vapor Concentration (mg/L)
Ben, TCE, and PCE. Furthermore,
the higher ratio obtained for TDCE Figure 3. Linear partitioning between chamber vapor and soil samples for
and conversely the lower one for the chlorinated analytes.
9


 Previous Page
