method for coarse aggregates was developed by
6"
the French in 1981. The basis of this test is that the
flow rate of an aggregate mass is affected by an-
4"
gularity, surface texture, and the bulk specific
gravity of the aggregate. The equipment neces-
60
60
sary for this type of test method can be found in
the Quebec Ministry of Transportation Aggre-
4"
4.5"
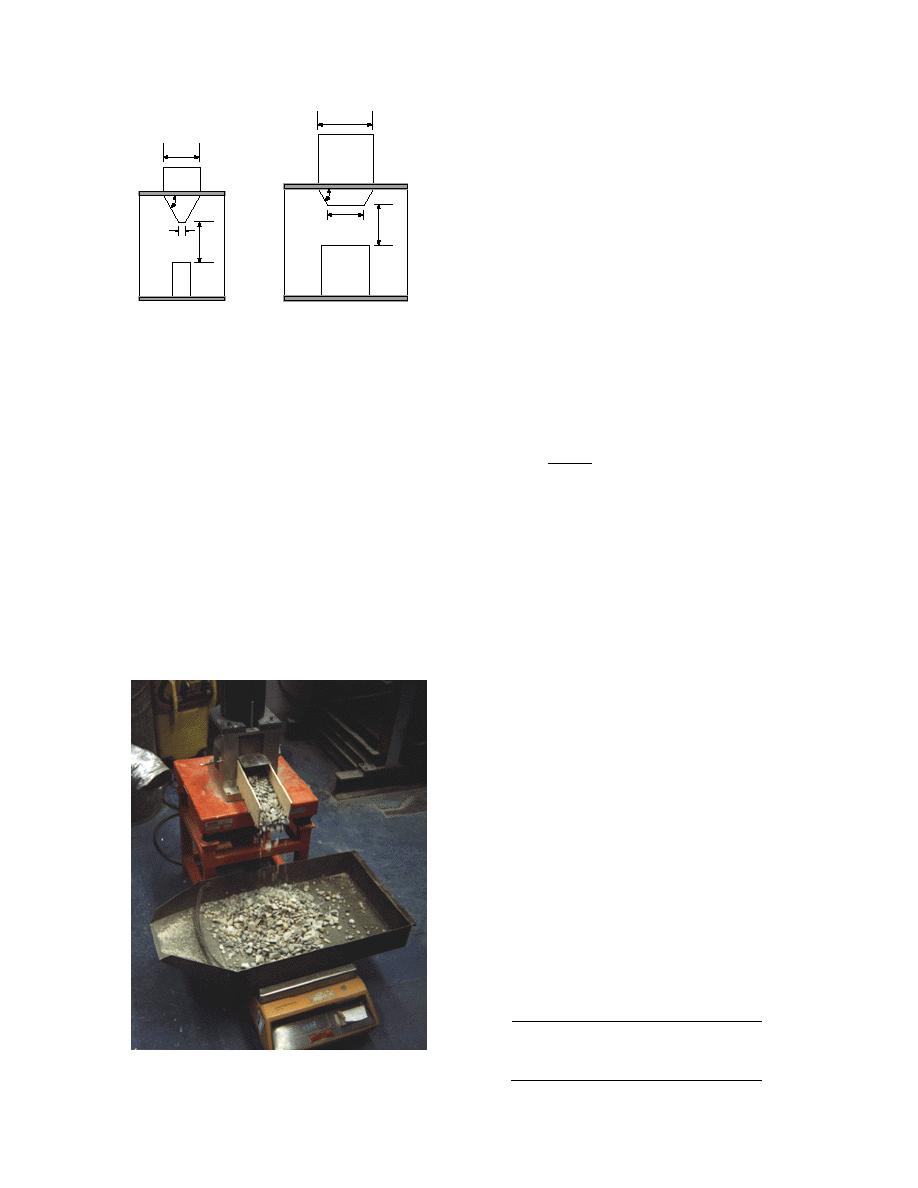
gates Laboratory in Quebec City, Quebec. Figure
0.5" 4.5"
17 shows the test apparatus.
The flow coefficient (Ce) of an aggregate is the
time required in seconds for 7 kg of material to
flow through a specified opening under a vibra-
Coarse Aggregate
Fine Aggregate
tory frequency of 50 Hz. The opening is 60 mm
Figure 16. Test apparatus for ASTM C 1252 and mod-
for material passing the 20-mm sieve and re-
ified ASTM C 1252. (After Aldrich 1996.)
tained on the 4-mm sieve. The maximum size cur-
apparatus, as pointed out by Aldrich (1996), is
rently tested with this equipment is 20 mm. The
similar to that developed by Ishai and Tons (1977)
flow coefficient (Ce) is determined from the fol-
for the Specific Rugosity Tests. The test method is
lowing equation:
similar to that used for fine aggregates and the
t Gsb
uncompacted void content is calculated using the
Ce =
k
same equation used for the fine aggregates. Ald-
rich (1996) reported that the UCV increased with
where Ce = flow coefficient
increasing angularity of the aggregates.
t = time (sec)
Gsb = bulk specific gravity
Time index
k = constant (1 second).
Several test methods exist for fine aggregates
The test involves first drying 10 kg of aggre-
where the rate of flow through a standardized or-
gate. This amount is then placed into the sample
ifice is used to index the material shape, angular-
tube. The vibrating table is turned on and 1 kg of
ity, and texture (Rex and Peck 1956, Tobin 1978).
material is allowed to collect in the pan on the
The time of flow is usually compared to a stan-
floor. The pan is set on a scale and the weight of
dard material, such as Ottawa sand. A similar test
the aggregate in the pan is monitored. After 1 kg
of material has collected in the pan, a stopwatch
is turned on. The watch is stopped when an addi-
tional 7 kg of material has collected in the pan.
The amount of time for 7 kg to collect in the pan is
noted. The test is repeated five times and the
average time value is determined.
The same material used for the image analysis
was tested using this equipment. The results are
shown in Table 13. The bulk specific gravity of the
aggregates was assumed to be 2.6.
The results indicate that, based on the flow
coefficients, crushed stone is more angular than
crushed gravel. This test can be conducted
quickly; further work in this area is warranted.
Table 13. Average flow coefficients for
Vermont subbase materials.
Average time
Flow
Material
(s)
coefficient
Crushed gravel
33.45
92.2
Crushed stone
44.13
114.7
Figure 17. QMOT time index test apparatus.
Pike crushed stone
44.62
116.0
15


 Previous Page
