cal distortion resulting from the video camera's
Digitization of recorded images
field of view. The correction method detailed by
Fujita and Komura (1994) was used for this pur-
pose. The distorted and corrected images are
Image enhancement
shown in Figure 13. For these experiments, the
pixel size was specified as 8 by 8 mm, resulting in
a corrected image containing 706 by 518 pixels.
The next step was to delineate the boundaries
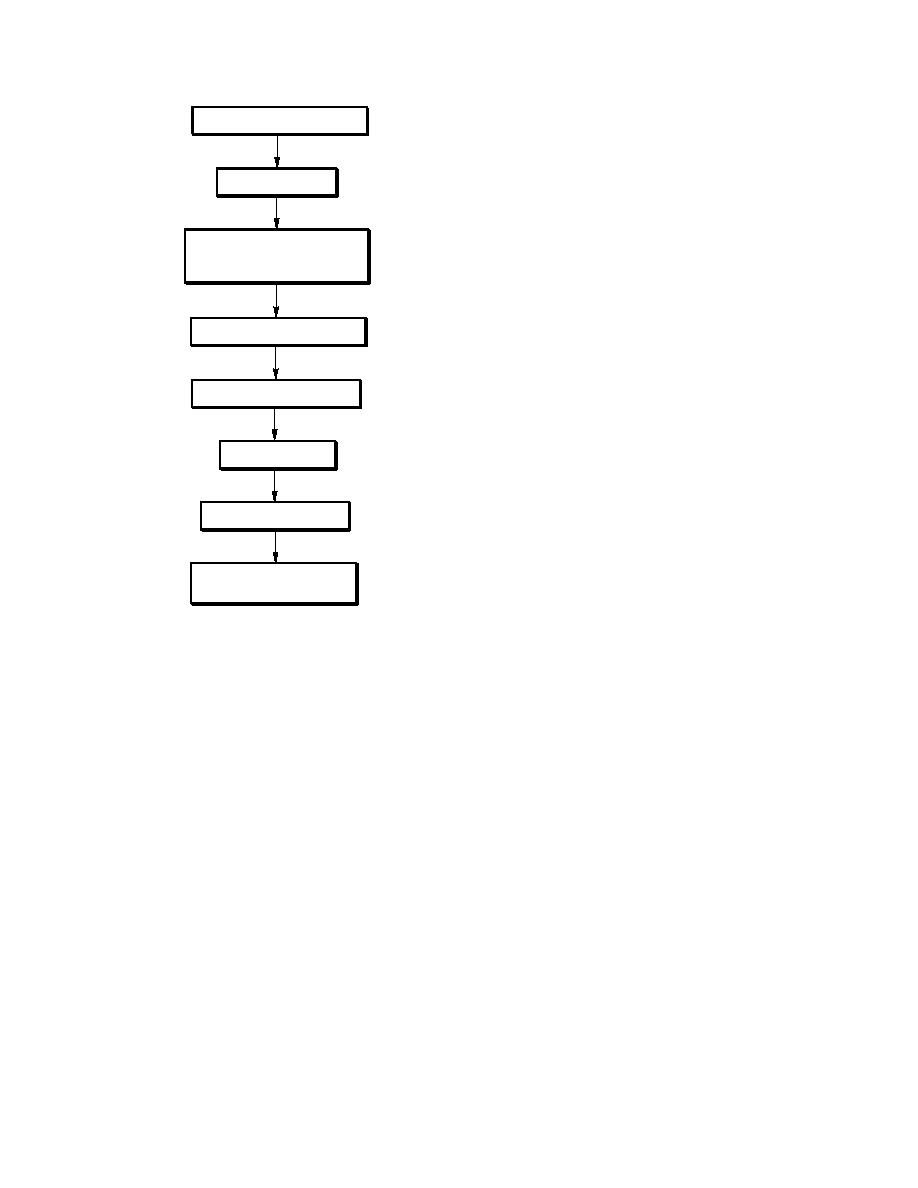
Determine the position of the
marker points in physical
separating out the analysis region (area of flow)
and CRT coordinates
within the corrected image plane where the PIV
analysis was performed. Regions outside of this
area are then blanked out. The PIV analysis was
applied only in interrogation spots that were at
Calculate mapping coefficients
least 50% within the analysis region, so that
velocity vectors could be determined at loci near
the boundaries.
Create a non-distorted image
The cross-correlation algorithm described pre-
viously was used to determine interrogation spot
movement between two video frames sampled 1
Set analysis region
second apart. For the fairly slow-moving model
ice pieces, this period practically gave an "instan-
taneous" velocity vector field, with the slowest
particle moving at least one pixel on the CRT
Image processing (Fig. 1)
screen. The interrogation spot size was 31 by 31
pixels, while the interrogation area was chosen
such that velocity vectors varied from 2 to 16
Plot velocity vectors
cm/s in the main flow direction and from 1.5 to
and additional information
15 cm/s in the direction normal to flow. The
velocity vectors were computed for a grid of 15
Figure 12. Flow chart of princi-
pixels in the main flow direction and 10 pixels in
pal steps in the PIV technique
the normal-to-flow direction. Time-averaged val-
used in this study.
ues of water and ice velocities were determined
from 100 instantaneous vector fields.
Once the processing was made final, cross-
As mentioned above, beads at low concentration
sectional velocity profiles for any section of the
were scattered over the free surface of the flow.
model were readily plotted. For the case of ice-
Subsequently, model ice was discharged from the
covered flow, the boundary between areas covered
hopper and allowed to drift into and through the
and areas free of ice was detected using the de-
confluence in a bank-to-bank, closely packed
gree of gray level of the background. Approxi-
single layer. The recording time and region to be
mately 100 seconds were needed, using the 133-
analyzed were established in accordance with the
Hz Pentium computer, to produce the 960-vector
objectives of the investigation. For the present
velocity fields presented as Figure 14. This period
study, the recording continued for about 10 min-
translates loosely to an approximate rate of 0.1
utes during each flow condition and covered the
second per vector in the flow field. With further
5.7- by 4.1-m area of the modeled confluence.
improvements in the technique (hardware and
The image-processing steps followed were
software), the processing time will decrease.
essentially those described by Fujita and Komura
(1995), who adapted the method for use in map-
ping water-surface velocities of rivers. Their
method was modified here for determining the
RESULTS
model-ice velocity field (Fig. 12).
The results given here illustrate major features
The first step in image processing required
of water flow and ice movement through the
determining the mapping coefficients to relate the
confluence of the Mississippi and Missouri rivers.
actual coordinates of the model area to those pro-
Presented first are mappings of water velocity dis-
jected on the cathode ray tube (CRT) forming the
tribution in the model confluence for the three
computer screen. The coefficients correct the opti-
18


 Previous Page
