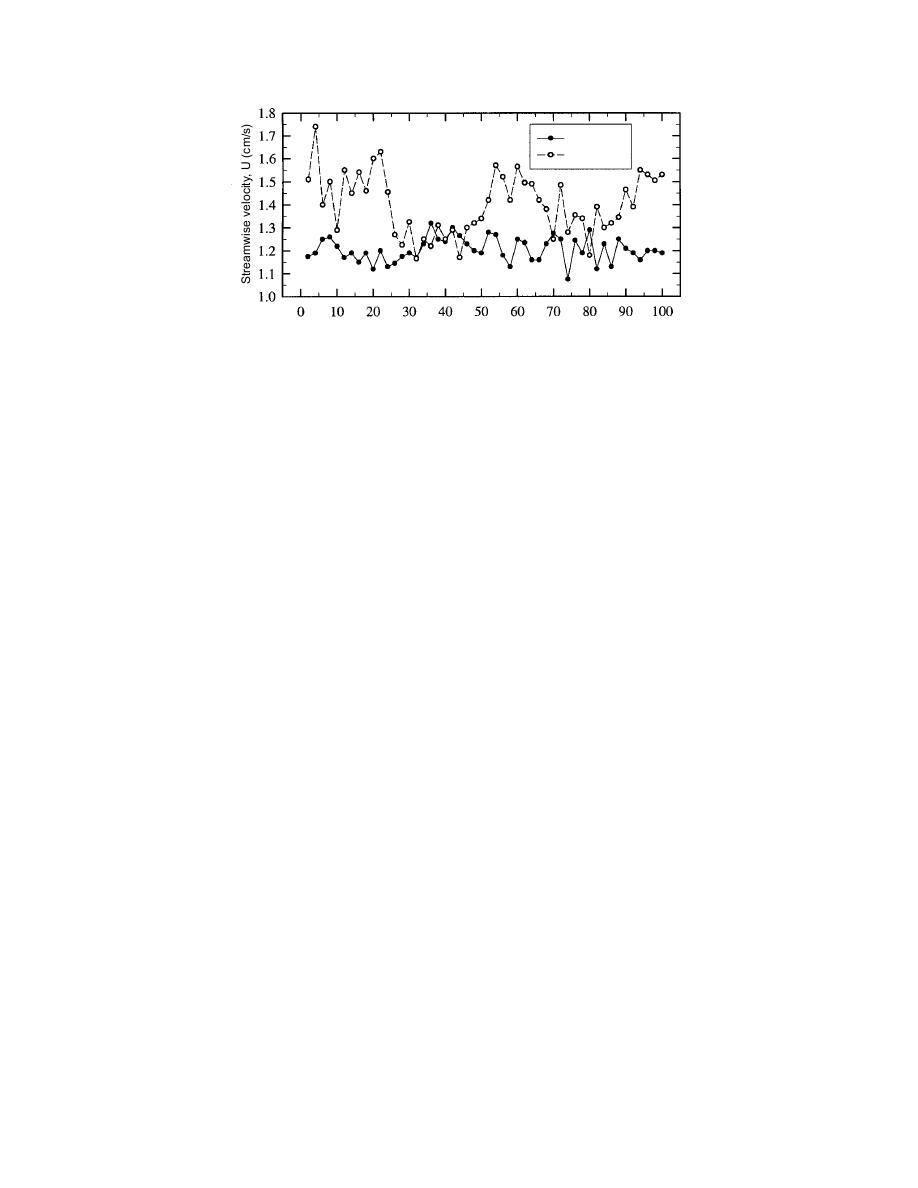
Ice run
Open water
Time (s)
Figure 16. Temporal variation of velocities at point A in Figure 14a.
in the model. The temporal variations of velocity
and when the confluence was constricted by bor-
at a single location, as shown for point A, are
der ice. The constriction increased model ice
readily obtained using PIV. It should be noted,
velocities and enlarged eddies in the shear layer
however, that sampling frequencies in the present
formed between the merging flows of the Missis-
application of PIV were not high enough to mea-
sippi and Missouri rivers. Commensurate with the
sure small-scale turbulence fluctuations of flow
enlarged eddies, model ice trajectories oscillated
velocities.
and velocities fluctuated more markedly in the
constricted confluence than in the confluence of
rectangular channels. Figure 19 shows the oscilla-
Ice velocities
Figure 17 shows how the model ice discharg-
tory motions of ice at points B and C marked on
ing from the simulated Missouri River moves
Figure 17b. At those locations, the model ice tra-
through the confluence for two of the channel
jectories and velocities oscillated at a period of
conditions: rectangular and alluvial-bed with bor-
about 0.07 seconds, which was low enough to cap-
der ice. Figure 17a shows ice vectors for the rect-
ture using the present PIV technique. A caveat
angular-channel condition. The corresponding ice-
regarding the use of the PIV technique for obtain-
velocity field for the condition in which the
ing information on oscillatory flows is that oscil-
confluence is constricted with border ice is shown
lation frequency should not exceed 1/60th of a
in Figure 17b. This latter figure indicates the
second, half the frame speed of a normal CCD
extent of a band of ice moving through the
video camera. Frequencies up to about 4000 Hz
confluence and shows how the band is deformed
can be obtained using a high-speed CCD video
by the shear layer between the confluent flows. If
camera.
ice thicknesses are known, local magnitudes of ice
Values of ice discharge and its distribution are
discharge are obtainable from the ice velocity dis-
readily obtainable from Figures 14 and 17, as the
tribution.
model ice was known to be moving in a single
The main inference to be made from the figures
piece thickness. If the model ice had formed mov-
is that, for the conditions modeled, ice from the
ing, thickening accumulations, thickness measure-
Missouri River does not, on average, spread across
ments would have been needed in conjunction
the full width of the confluence. However, the large
with the PIV measurements to determine ice dis-
eddies that form in the unsteady shear zone
charge and its distribution.
between the merging Missouri and Mississippi
The series of photographs presented in Figures
flows caught ice and "flung" it across the Missis-
20 and 21 illustrates views of ice movement
sippi River. A sign of the unsteadiness of flow
observed in the model for the conditions of rect-
between the merging flows can be seen in Figure
angular channel and alluvial channel fitted with
17c, which shows the ice-movement vectors
border ice.
determined between two video frames.
Figure 18 shows how the ice velocities varied
Ice transport through the confluence
across selected cross sections of the confluence,
The hydraulic model indicates that ice enter-
both when it was fitted with rectangular channels
ing the confluence from the Missouri does not
22


 Previous Page
