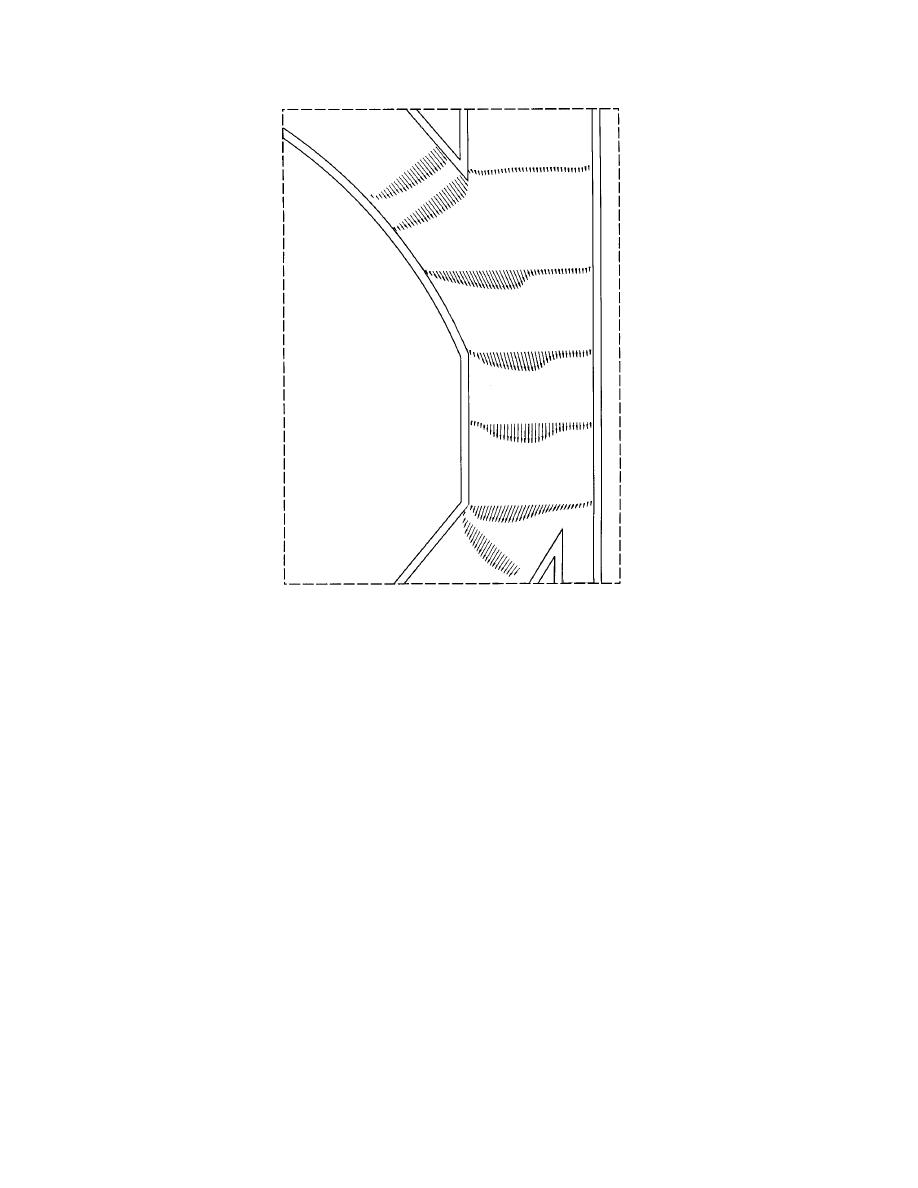
← : 10 cm/s
Figure 15. Cross-sectional distributions of the water-
surface velocities shown in Figure 14c.
frames (i.e., about 1 second apart). The velocity
channel conditions: rectangular, alluvial-bed, and
fields are practically the same for Figures 14b and
alluvial-bed with border ice. The mappings of ice
14c, except that the "instantaneous" distribution
movement distribution associated with those flow
reveals more of the oscillatory shear layer between
conditions are then presented. The data are then
the two confluent flows.
discussed for some implications on improvement
The data contained in Figure 14 can readily be
of ice movement through the MississippiMissouri
manipulated and presented alternately as cross-
confluence and through confluences generally.
sectional distributions of velocities. Figure 15 pre-
sents cross-sectional distributions of flow for the
Water velocities
flow field shown in Figure 14c. The measurements
The distributions of surface velocity shown in
show that, besides its facility for mapping surficial
Figure 14 demonstrate how water flows from the
distributions of surface velocities of water flow
Mississippi and Missouri rivers merge for the three
and ice movement, the PIV technique can produce
simulated channel conditions: rectangular, allu-
readily usable velocity data for determining vari-
vial-bed, alluvial-bed with border ice. Figure 14a
ous aspects of a flow. In the present case, the mea-
shows the velocities, averaged over 100 video
surements were analyzed further to ascertain
frames, for flow through the rivers replicated as
whether PIV could capture the temporal variabil-
simple rectangular channels. Figure 14b is a simi-
ity in water and ice velocities attributable to low-
lar figure (also based on 100 frames) for flow
frequency eddies formed in the water and the ice
through the model rivers fitted with the alluvial
by the confluent water flows. Figure 16 shows the
bed bathymetry. To show how the velocities fluc-
temporal variation of water and ice velocities at
tuate in the shear zone between the two flows, Fig-
point A (shown on Fig. 14a) located in the oscilla-
ure 14c presents an instantaneous view of the
tory shear layer formed by the two confluent flows
velocities, which was taken between two video
21


 Previous Page
