with TDR probes were dried from a saturated-
uniform moisture content when the moisture
surface-dry condition to an oven-dry condition, a
content at its center was within a half percent of
small amount at a time. It was important to not
the moisture content at its surface. We arrived at
dry the specimens too much at any one time (to
this definition because the TDR system was able
to detect moisture only to within 1/2% during
create too few opportunities for TDR readings) or
too little (to create unnecessary work). About 1%
this study (see Discussion). Thus, we considered
moisture loss per drying time seemed appropri-
moisture to be equilibrated when the differences
ate. Thus, Figure 2 helped us to determine how
across the specimens were no greater than this
long to keep a specimen in the drying oven. For
amount. To determine when concrete or mortar
example, to cause the initial 1% moisture loss
would reach this condition, dummy specimens,
required only 3 hours of drying, whereas it took
at various moisture contents, were placed into the
60C oven. Specimens were removed from the
up to 1 week of drying to cause the same moisture
loss during the latter stages of drying. The final
oven at various times, placed in plastic bags, and
(oven-dry) condition was attained by keeping the
periodically tested for moisture by crushing the
specimens in a 105C oven for 24 hours.
specimens with a laboratory compression tester
Table 5 shows how soon a specimen of mortar
and obtaining small samples from the outer and
or concrete will attain a uniform moisture content
center portions of each specimen. The samples
after it has been removed from the drying oven.
retrieved from each specimen were then immedi-
The specimens were sealed inside individual
ately weighed and dried to constant weight in a
105C oven. The data (Table 5) show that mortar
plastic bags while the moisture equilibrated with-
in the specimens. A specimen was defined to be of
reaches a uniform moisture condition within 1
day after being removed from the oven, whereas
Table 5. Time for moisture to be-
concrete requires up to 9 days. In our testing, all
come evenly distributed within
specimens were kept in individual plastic bags
76- 152-mm concrete and mor-
for 9 days before TDR readings and weights were
tar cylinders after they were
obtained.
removed from the 60C oven.
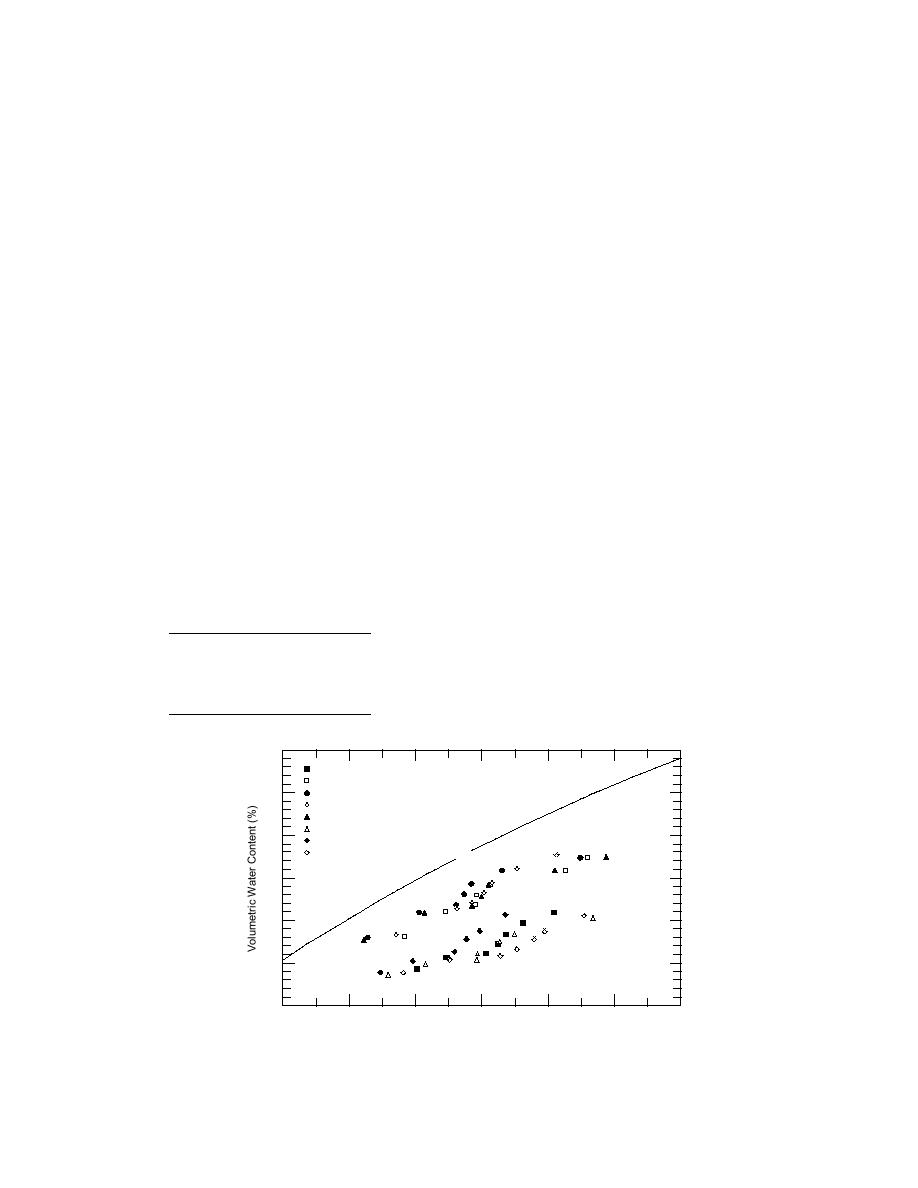
Figure 3 shows a plot of dielectric content vs.
Time out
Difference
water content for concrete and mortar specimens.
of oven
center-to-surface
A plot of Topp's equation for soils is shown for
(days)
(%)
comparison. The specimens were subjected to six
Concrete
2
1.59
drying cycles in the 60C oven. In those six cycles,
Concrete
5
1.24
the concrete dried from a volumetric moisture
Concrete
9
0.24
content of about 11% to about 4%, while the mor-
Mortar
1
0.16
Mortar
2
0.11
tar dried from about 18% to about 8%.
30
Part I Concrete, 13.2-mm agg
Part I Mortar
tion
qua
25
Part I Mortar
E
s
pp'
Part I Mortar
To
Part I Mortar
Part II Concrete, 13.2-mm agg
20
Part II Concrete, 9.5-mm agg
Part II Concrete, 9.5-mm agg
15
10
5
0
4
6
8
10
12
14
16
Dielectric Constant (K)
Figure 3. Dielectric constant vs. water content for all concrete and mor-
tar specimens.
5


 Previous Page
